Chinese Yuan Devaluation Pattern

Working with lots of charts every day, I often come across a pattern that is very convincing. This is one of those cases. Every year for the past few years, the CNY has topped against USD in Q1 in a similar pattern.
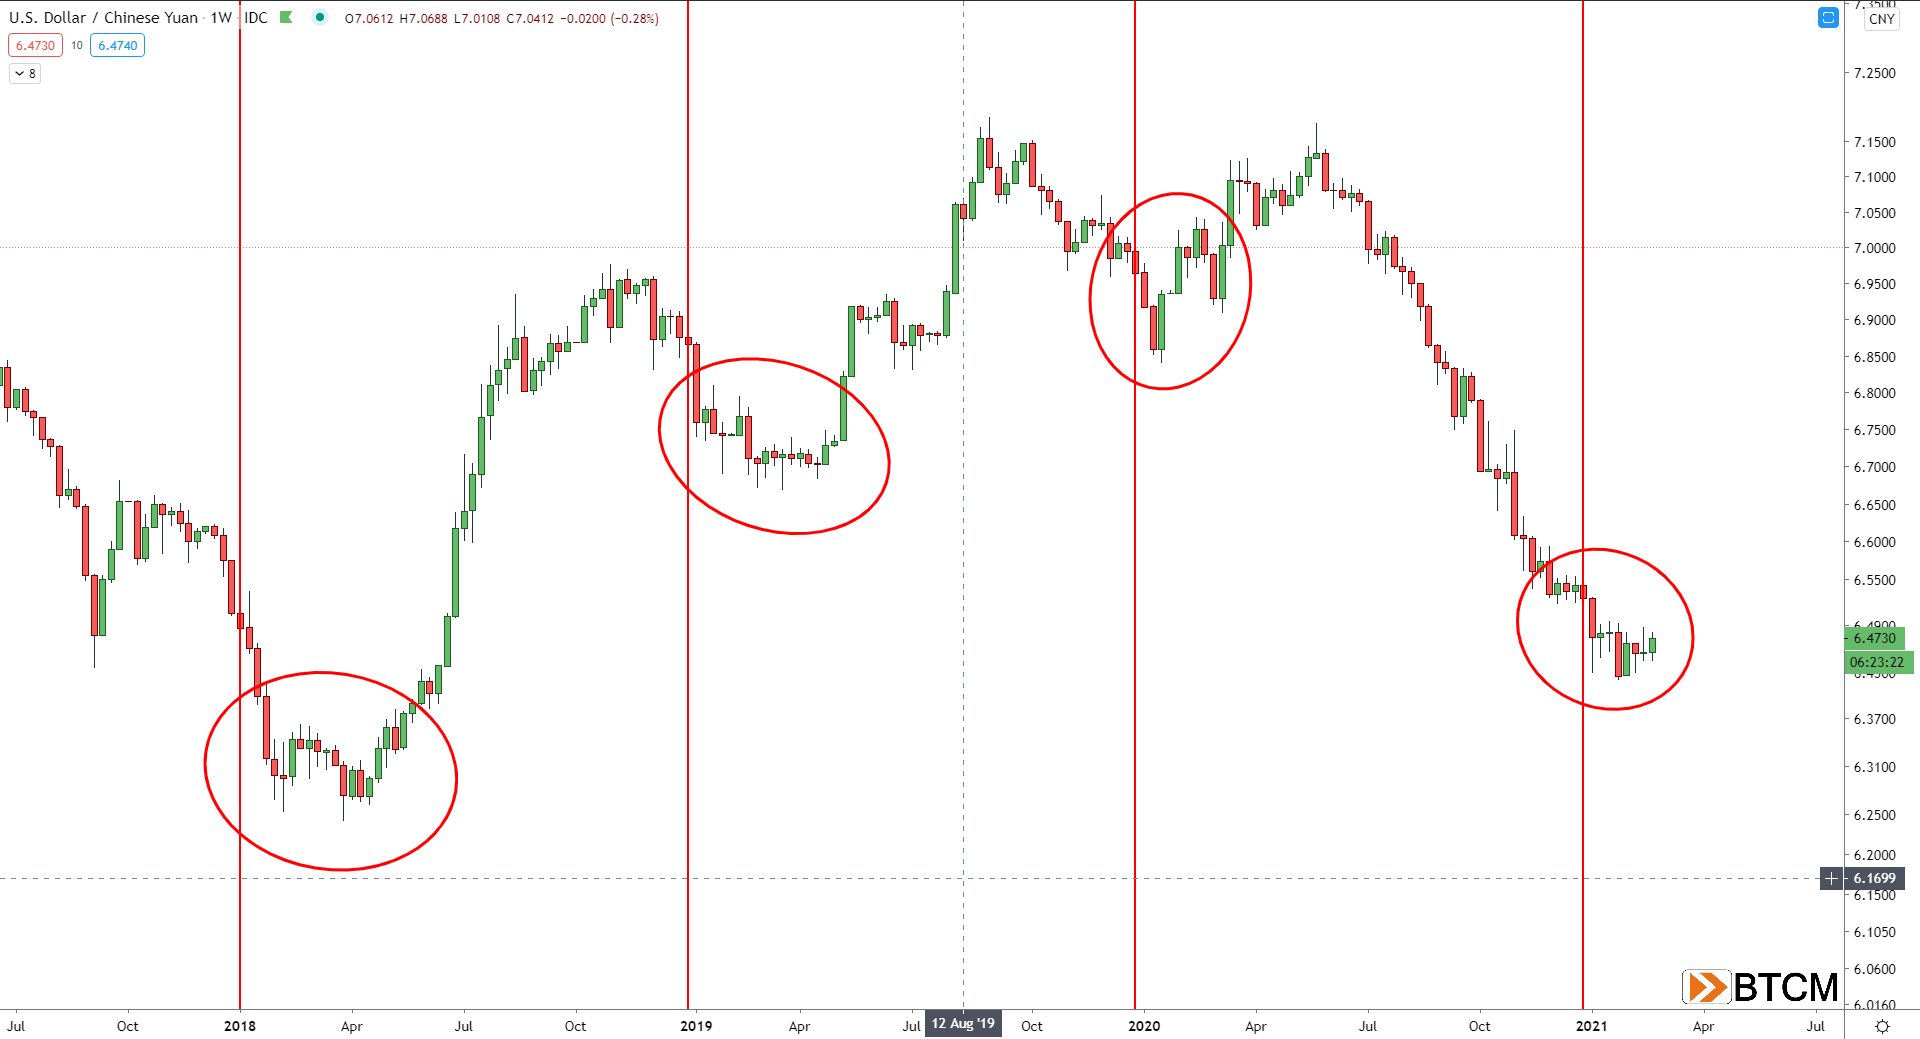
Officially, China has not devalued their currency on purpose since 2015. Either they are withholding that information or this is some natural process, possibly around Lunar New Year. They called their 2015 devaluation a "one-off devaluation of the renminbi," and have used that terminology several times in the years since, but haven't gone as far as to say they actually intervened in markets.
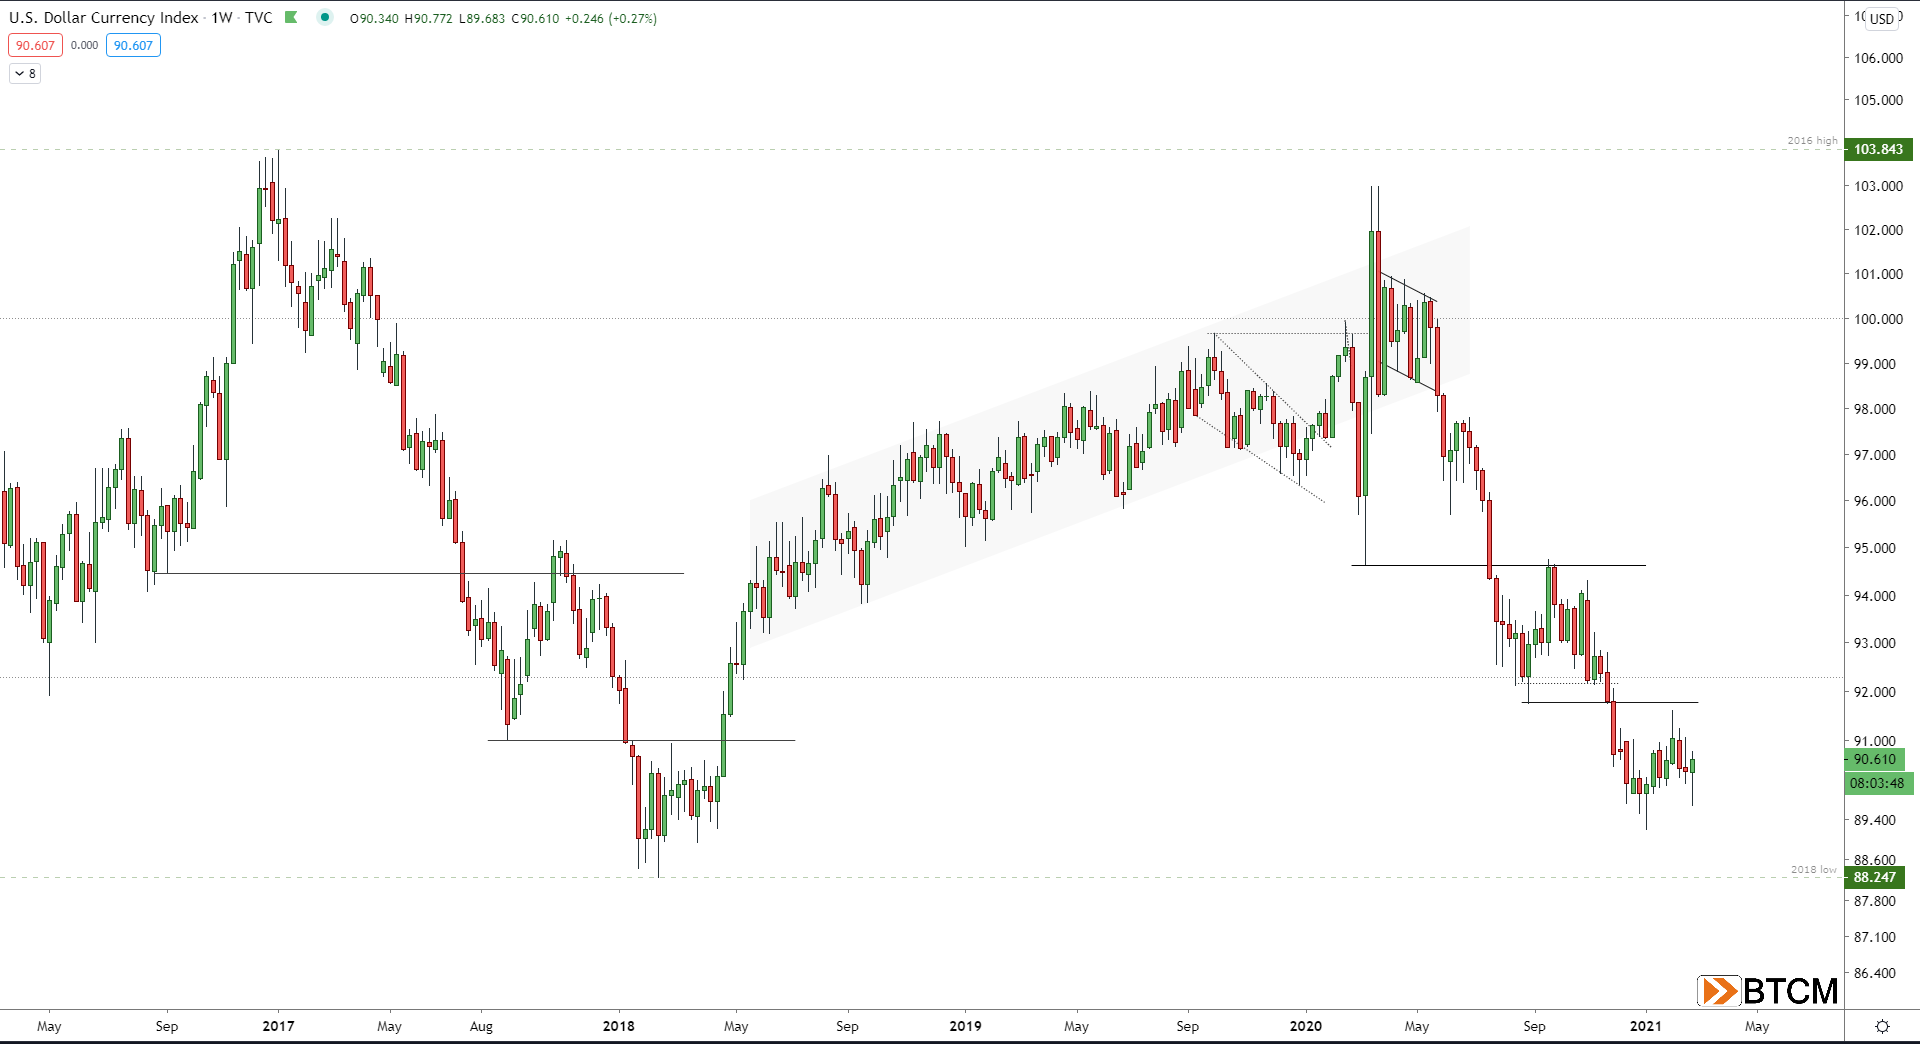
If this pattern is to continue, which I think is likely, the Yuan should begin to weaken in the next several weeks. This would also match with the coming dollar rally. The DXY appears to be roughly halfway through its bottoming pattern on the charts, and rising interest rates and rising oil prices are taking their toll on the global economy.
A strong CNY is not good for CCP exports, but is good for the planned transistion for China from a production led economy to a consumption led economy. However, they are still mired in the middle income trap. They are not wealthy enough per capita to be consumer led, but too expensive to be a low cost labor market.
It is possible that the strong CNY is putting pressure on the CCP controlled economy but we will have to wait and see what happens next.
Enjoying these posts? Subscribe for more
Subscribe nowAlready have an account? Sign in