Macro Chart Rundown for 5/5/2021

Welcome back to BTCM Research. Please subscribe if you are finding these chart updates informative. Today, we examine Bitcoin, Ethereum, US dollar, crude oil, stocks, commodities, and gold and silver!
Bitcoin
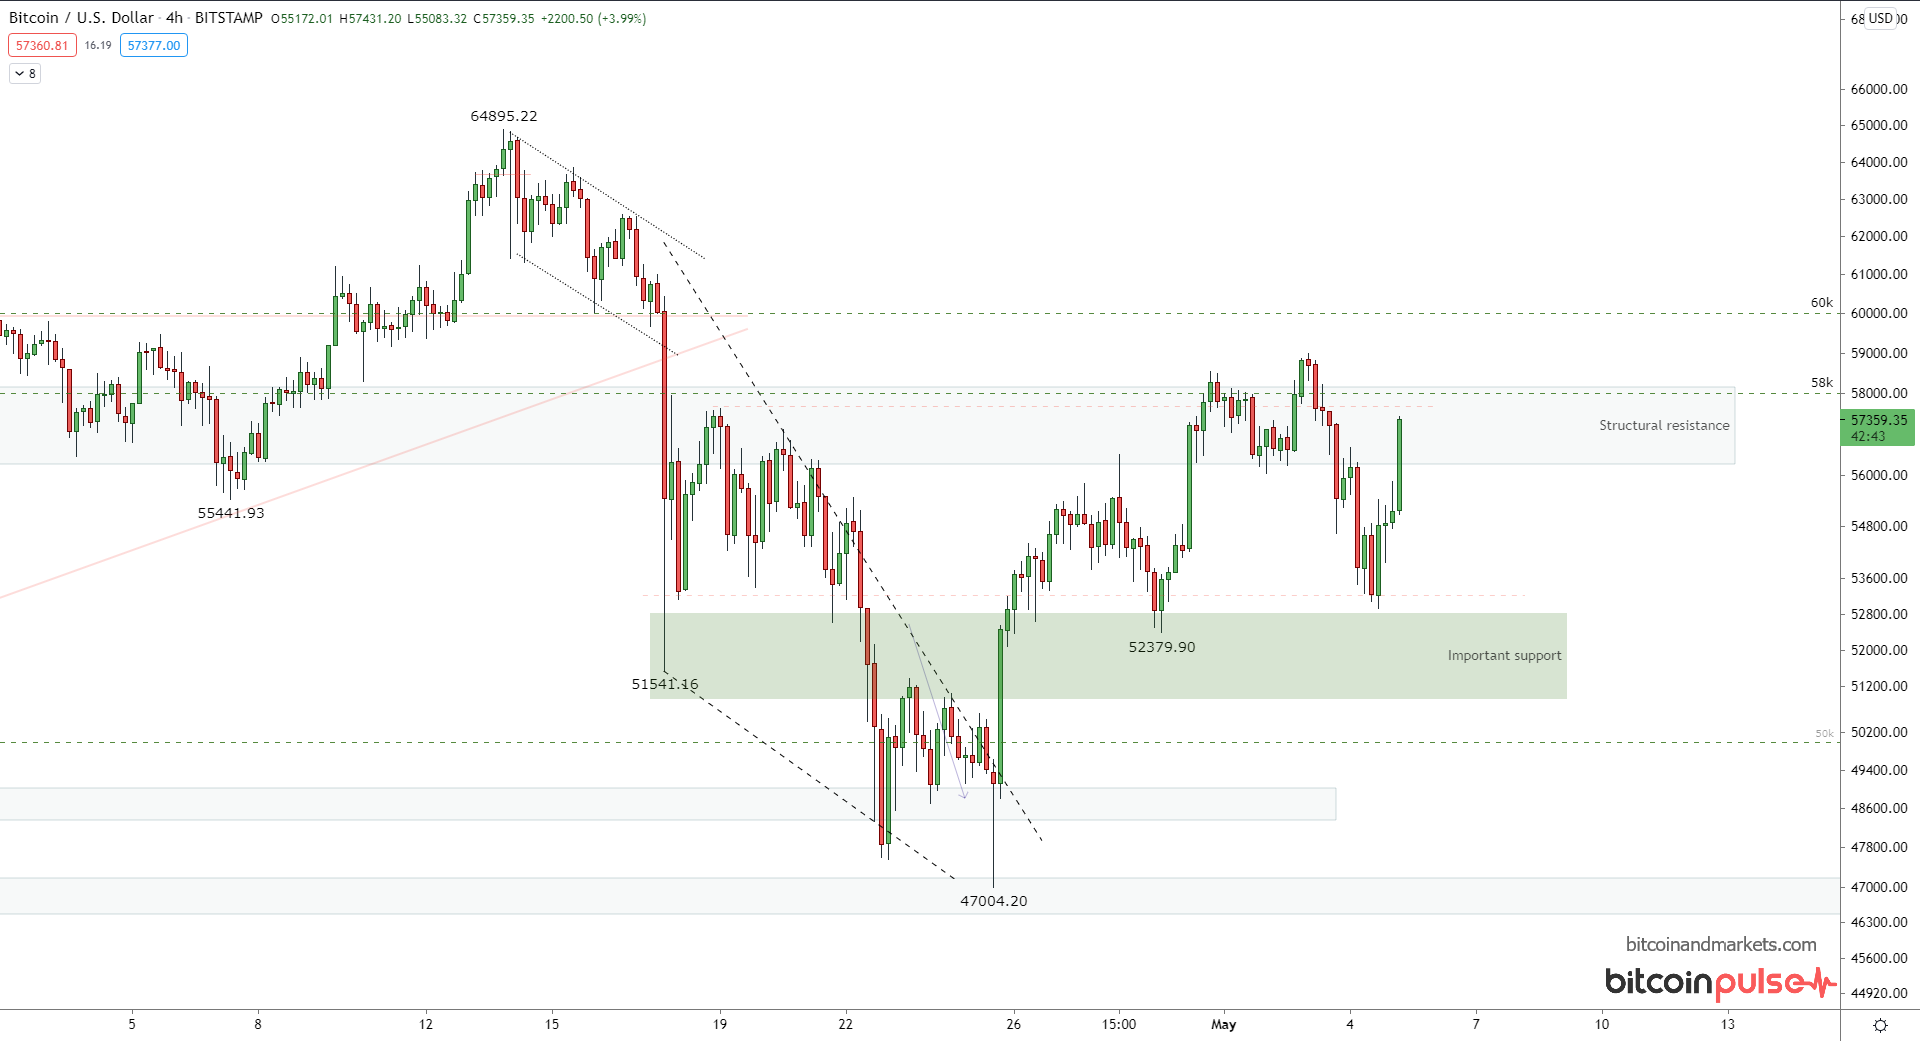
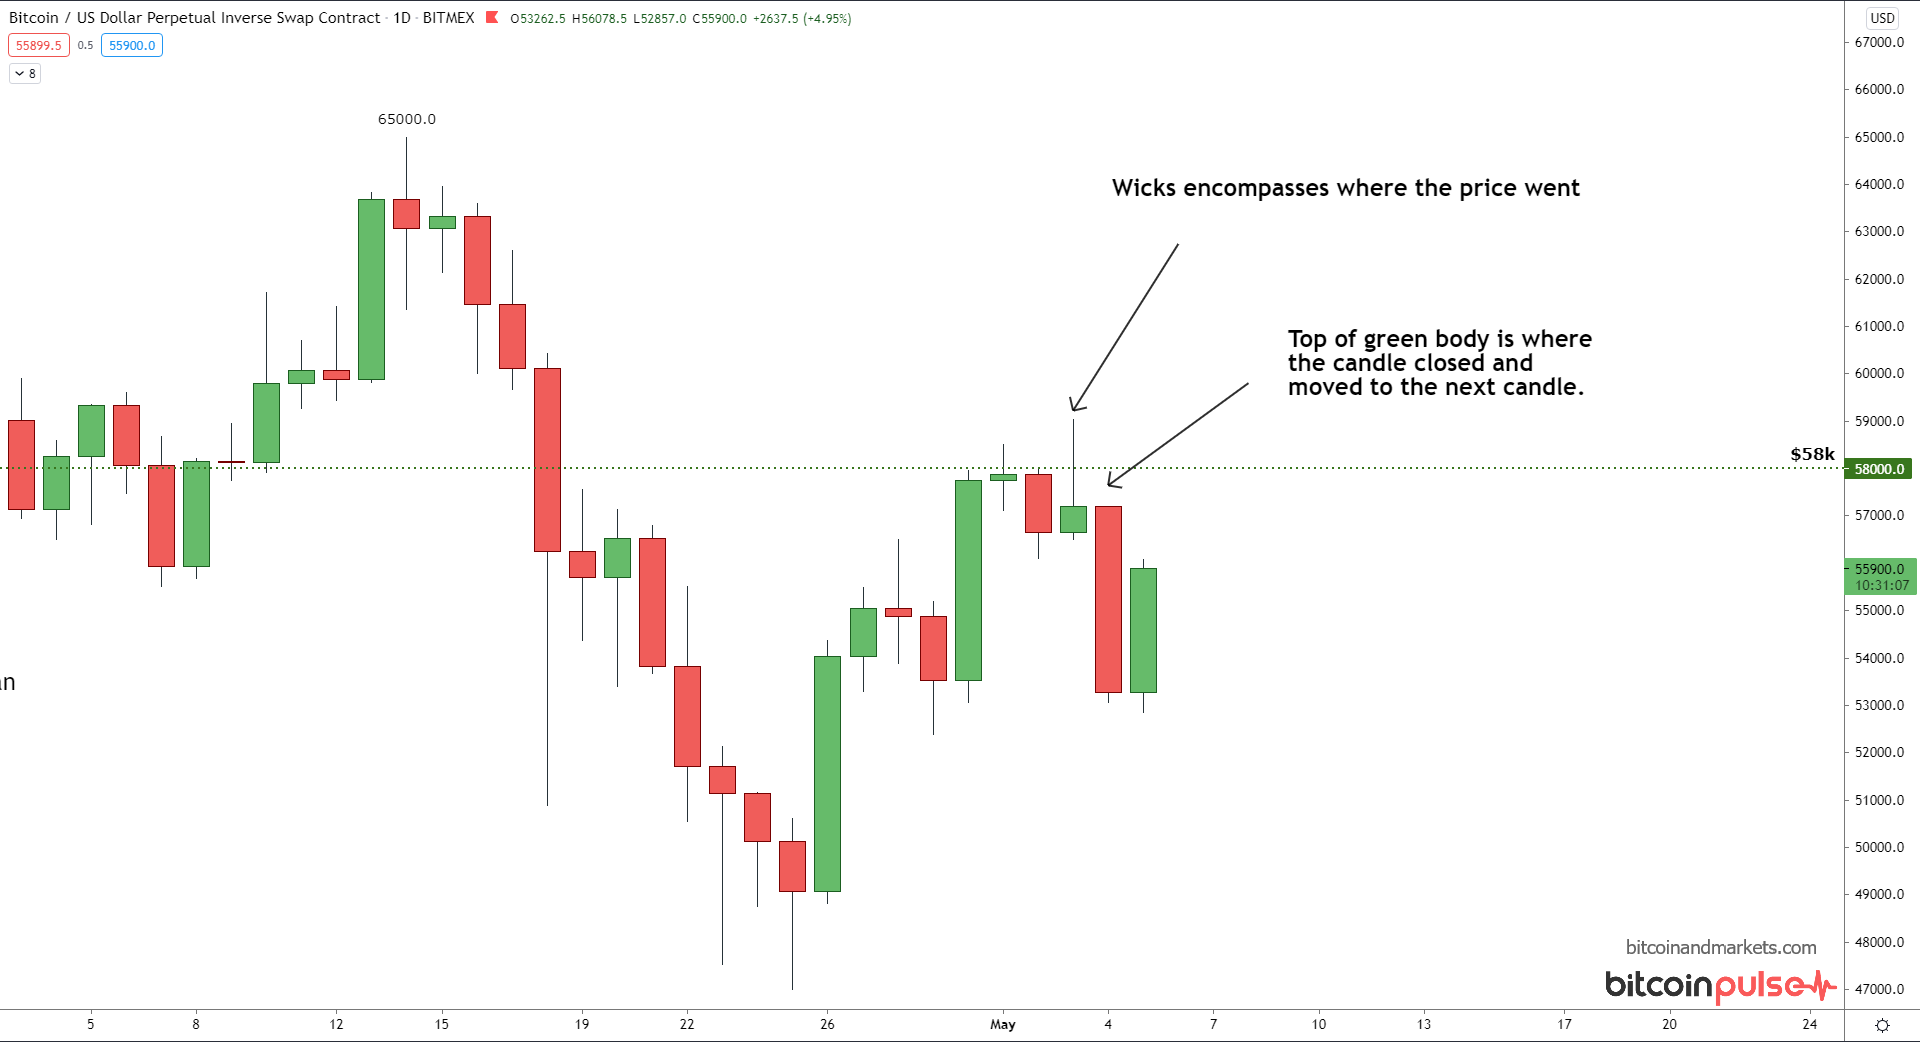
Last week, I said $58k was a pivotal price and to watch out when it was testing that level. Well, price did break $58k but was immediately rejected. In times like those, at least a daily candle close over that level is a good confirmation (below example), along with increased volume and a continuation higher. We didn't see any of those hallmarks. The daily candle on the 3rd, touched $59,000 but very quickly sold off to close the daily at $57,222. Also, volume was extremely muted the whole rally.
I'm slightly concerned that a blow off top in altcoins could adversely affect bitcoin. Price is struggling a bit here, and yesterday the chart looked quite bearish. I think it is more likely that an altcoin crash could benefit bitcoin as people move what value they can back to bitcoin, but there is a slight chance that altcoins drag bitcoin down, too. I'm very interested in seeing how bitcoin works its way through the summer doldrums.
Don't forget, bitcoin is in a bull market. That alone is worth a tiebreaker at certain points in the chart. When everyone gets on the bearish side of the boat, it tips over.
For more technical analysis on bitcoin specifically, along with more macro commentary, subscribe to the Bitcoin Pulse at bitcoinandmarkets.com.
Ethereum
I am not a fan of Ethereum. In my opinion, it is too complicated, too centralized, and too deceitful to ever be secure or long term successful. But, ponzi schemes can go on a long time and ETH is pumping right now. So, we should give it a look.
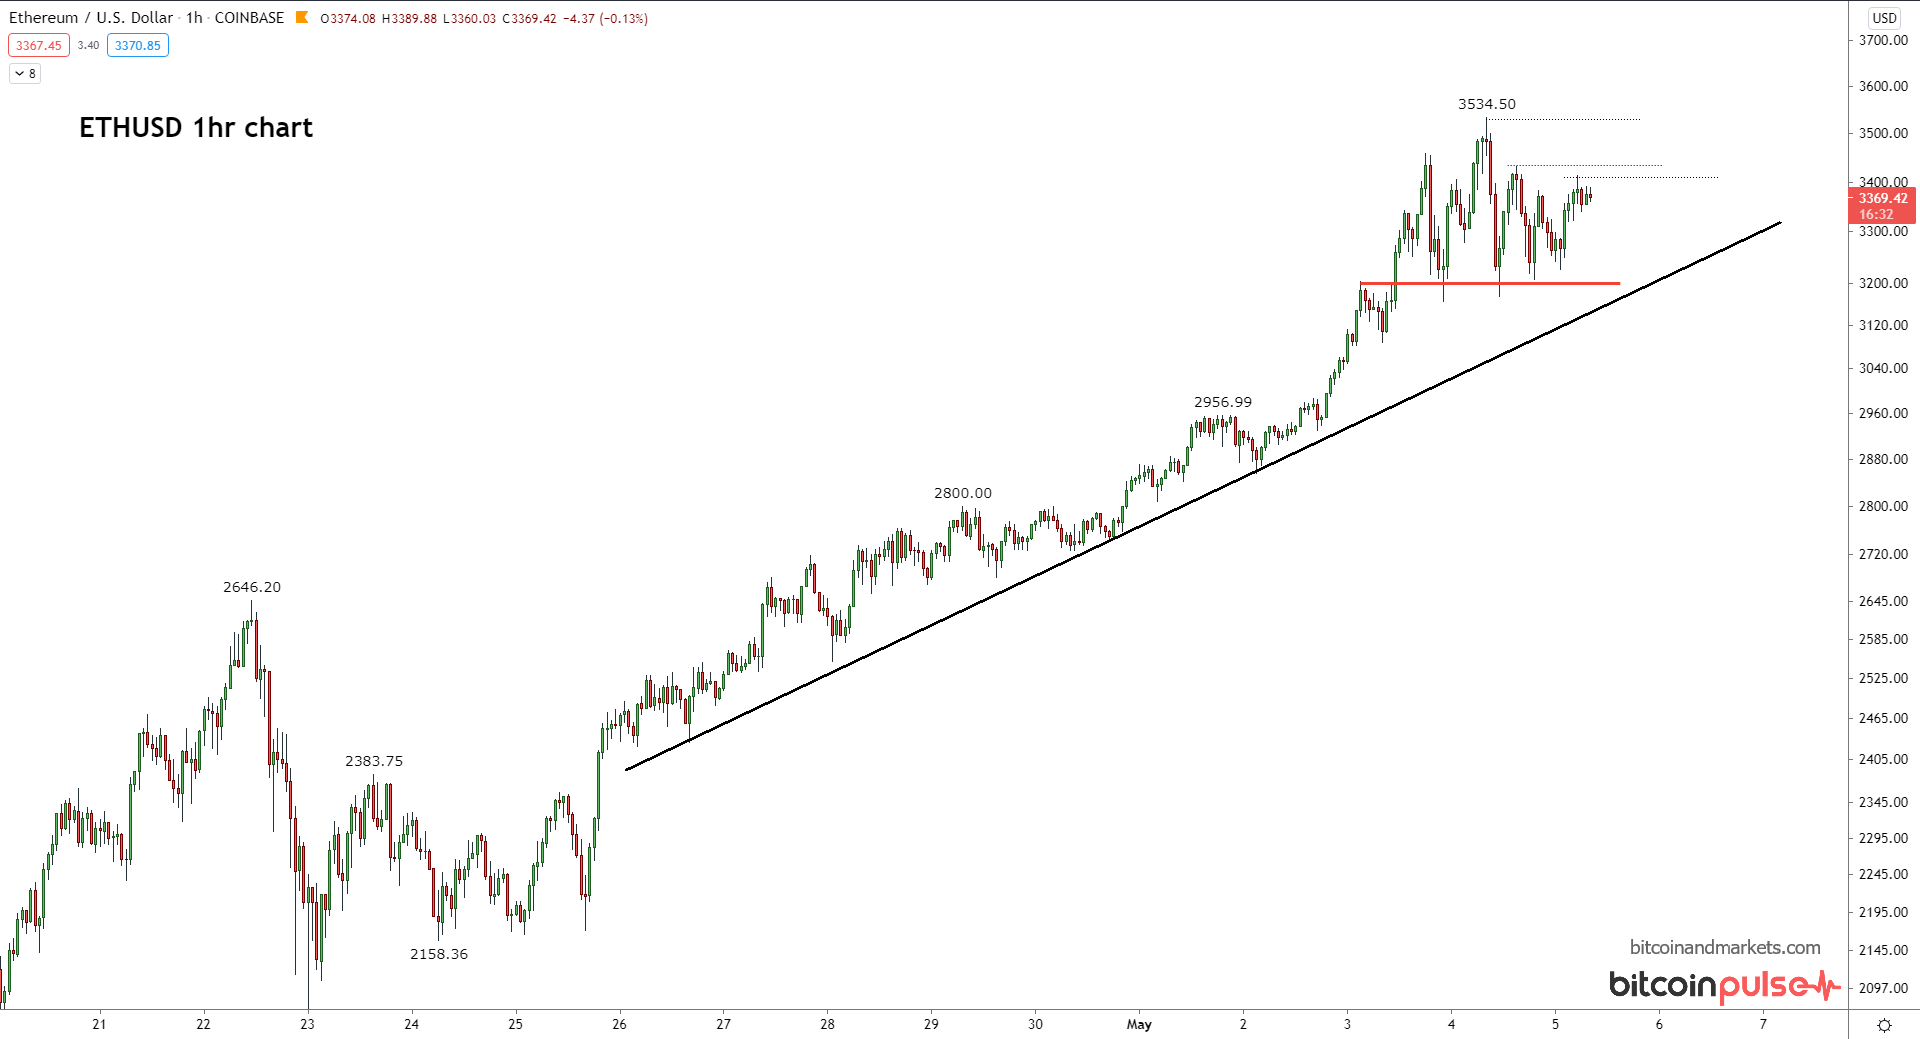
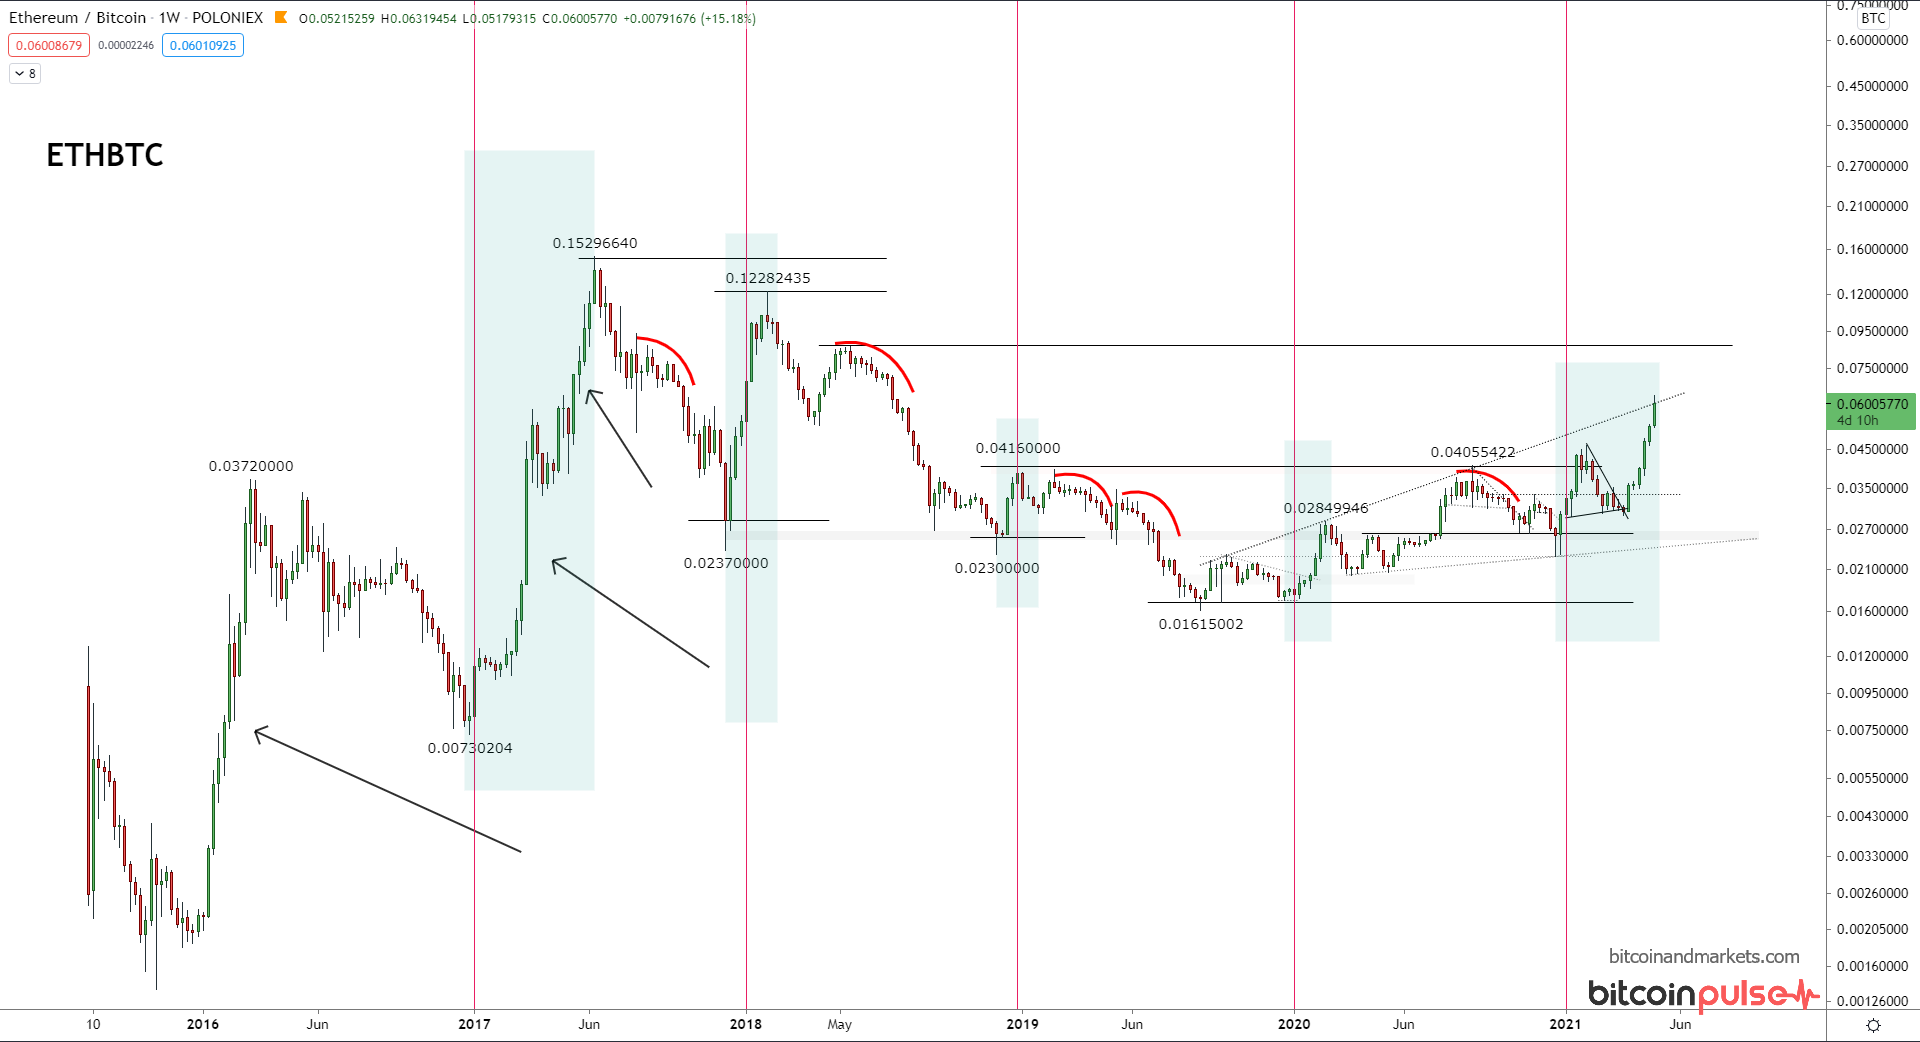
Don't forget, these are log charts. The underlined trend is a 50% move in 9 days.
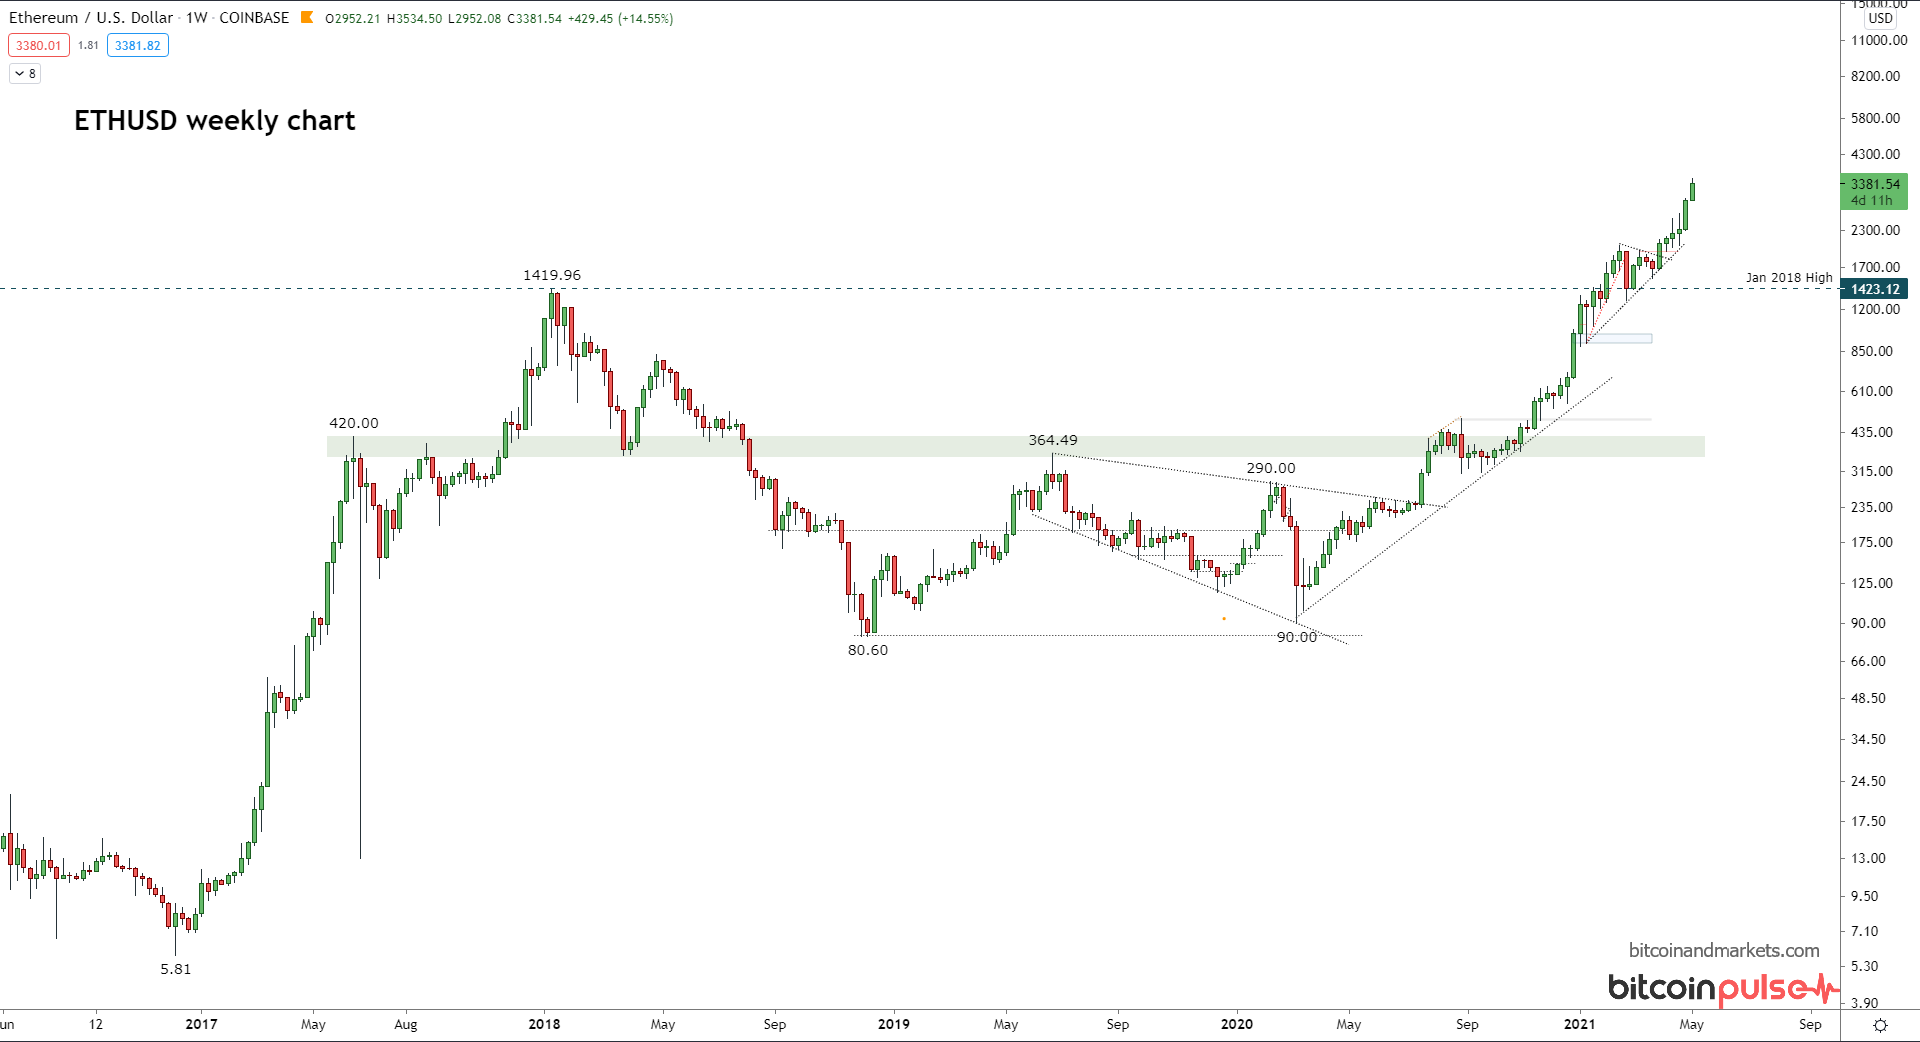
The history of Ethereum can fit nicely on the a weekly chart. I have no prediction for the Ethereum price, because the fundamentals of Ethereum are ponzi fundamentals. It is a platform for other scams as well. So a traditional analogy might be a pink-sheet exchange (a stock exchange that trades micro-cap companies) or a casino.
Ethereum's market cap today is $390 billion of which, approximately $389 billion is pure fantasy.
Quickly looking at it against bitcoin. There's a lot going on here, but you can see price is quite far from the ATH, about 60% to be exact. I've also drawn vertical lines at the turn of each year, and highlighted the pumps that correspond. If this pattern continues, we can expect this rally to end soon, and the rest of the year should be going down against bitcoin.
Dollar Index (DXY)
This week the dollar had many people confused. 'Is the dollar actually going to break out higher? Wait, is the relief rally over and it is going lower?' This is the confusion that is present when you don't have an overarching thesis like we do here on BTCM Research.
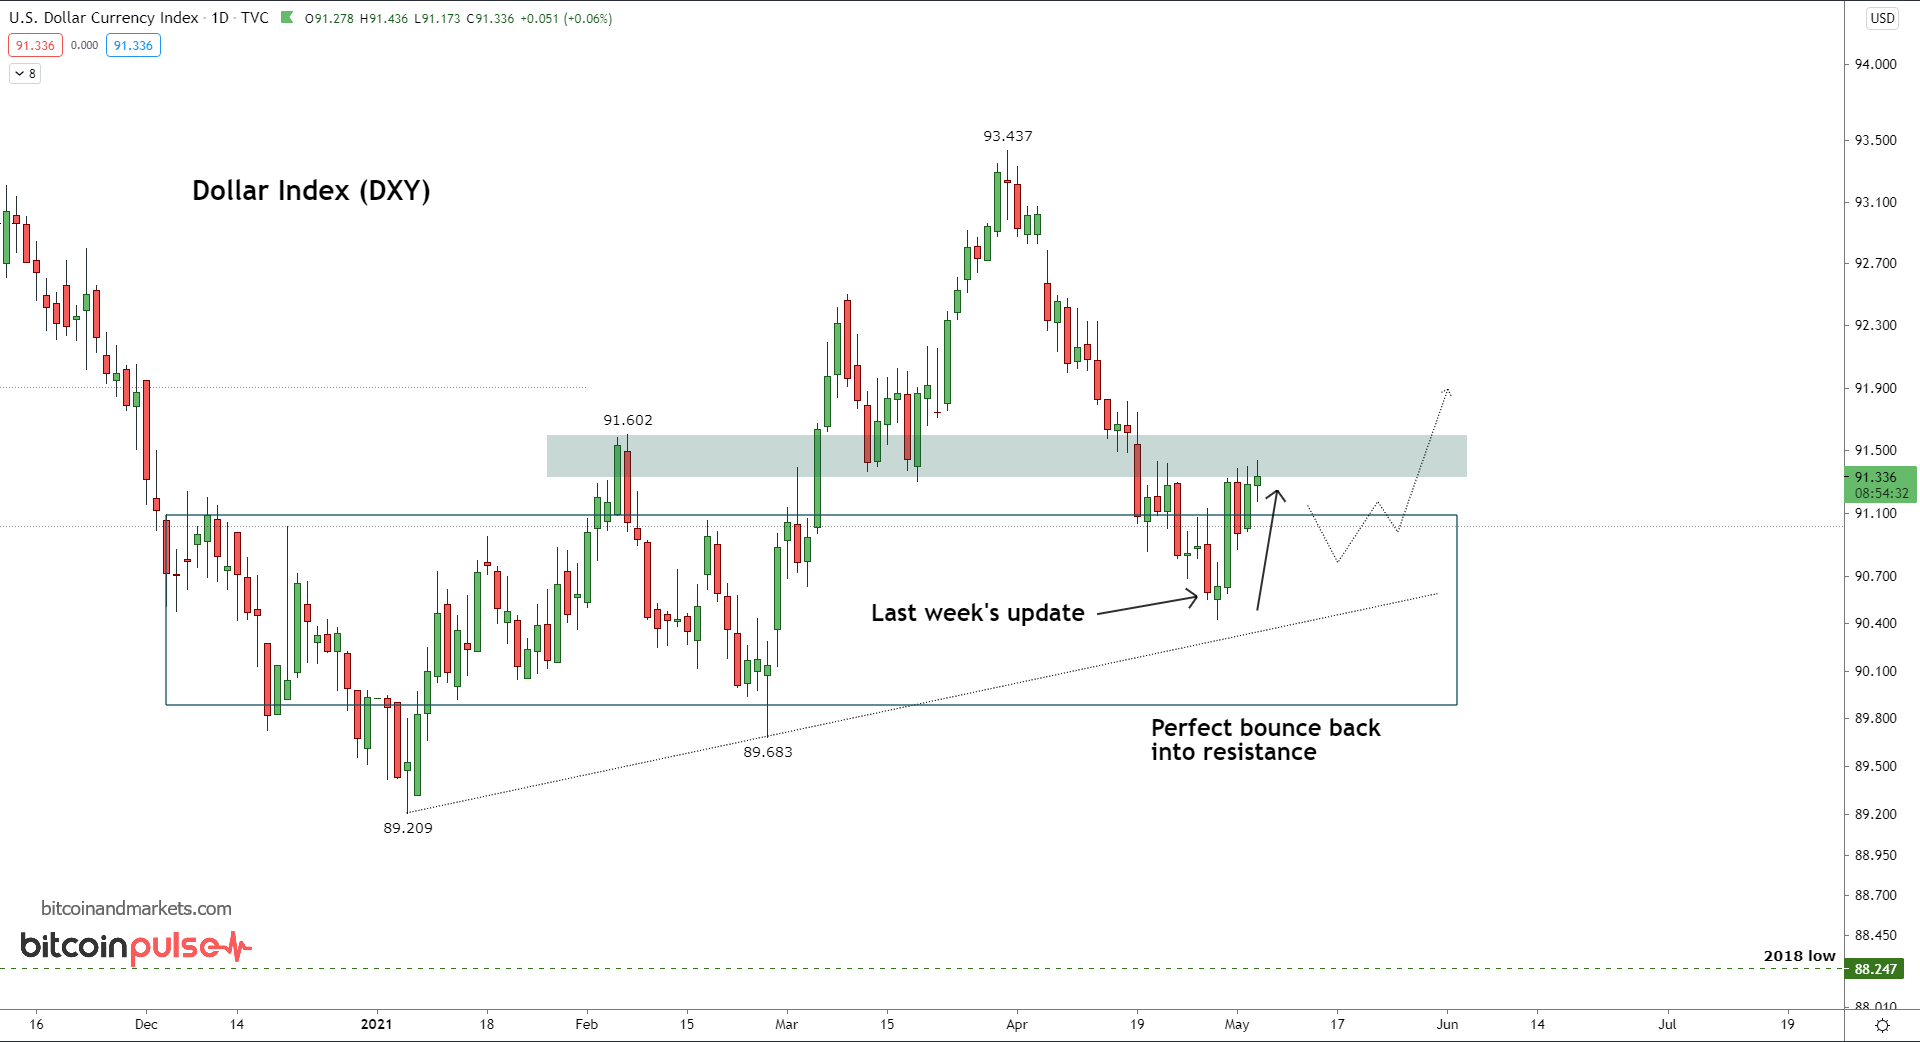
We are in a strong dollar environment. The dollar should be expected to appreciate relative to other currencies. In the last 1 year, the dollar has gone down relative to other currencies by only 8%, that is despite everything the Fed and US government has done to crash it. The dollar never even got down to the 2018 low.
I still think the next move is higher, but the dollar could bounce around under the resistance zone (dashed arrow) before breaking above it. The dollar usually has an inverse relationship with stocks, oil, and gold.
WTI Crude
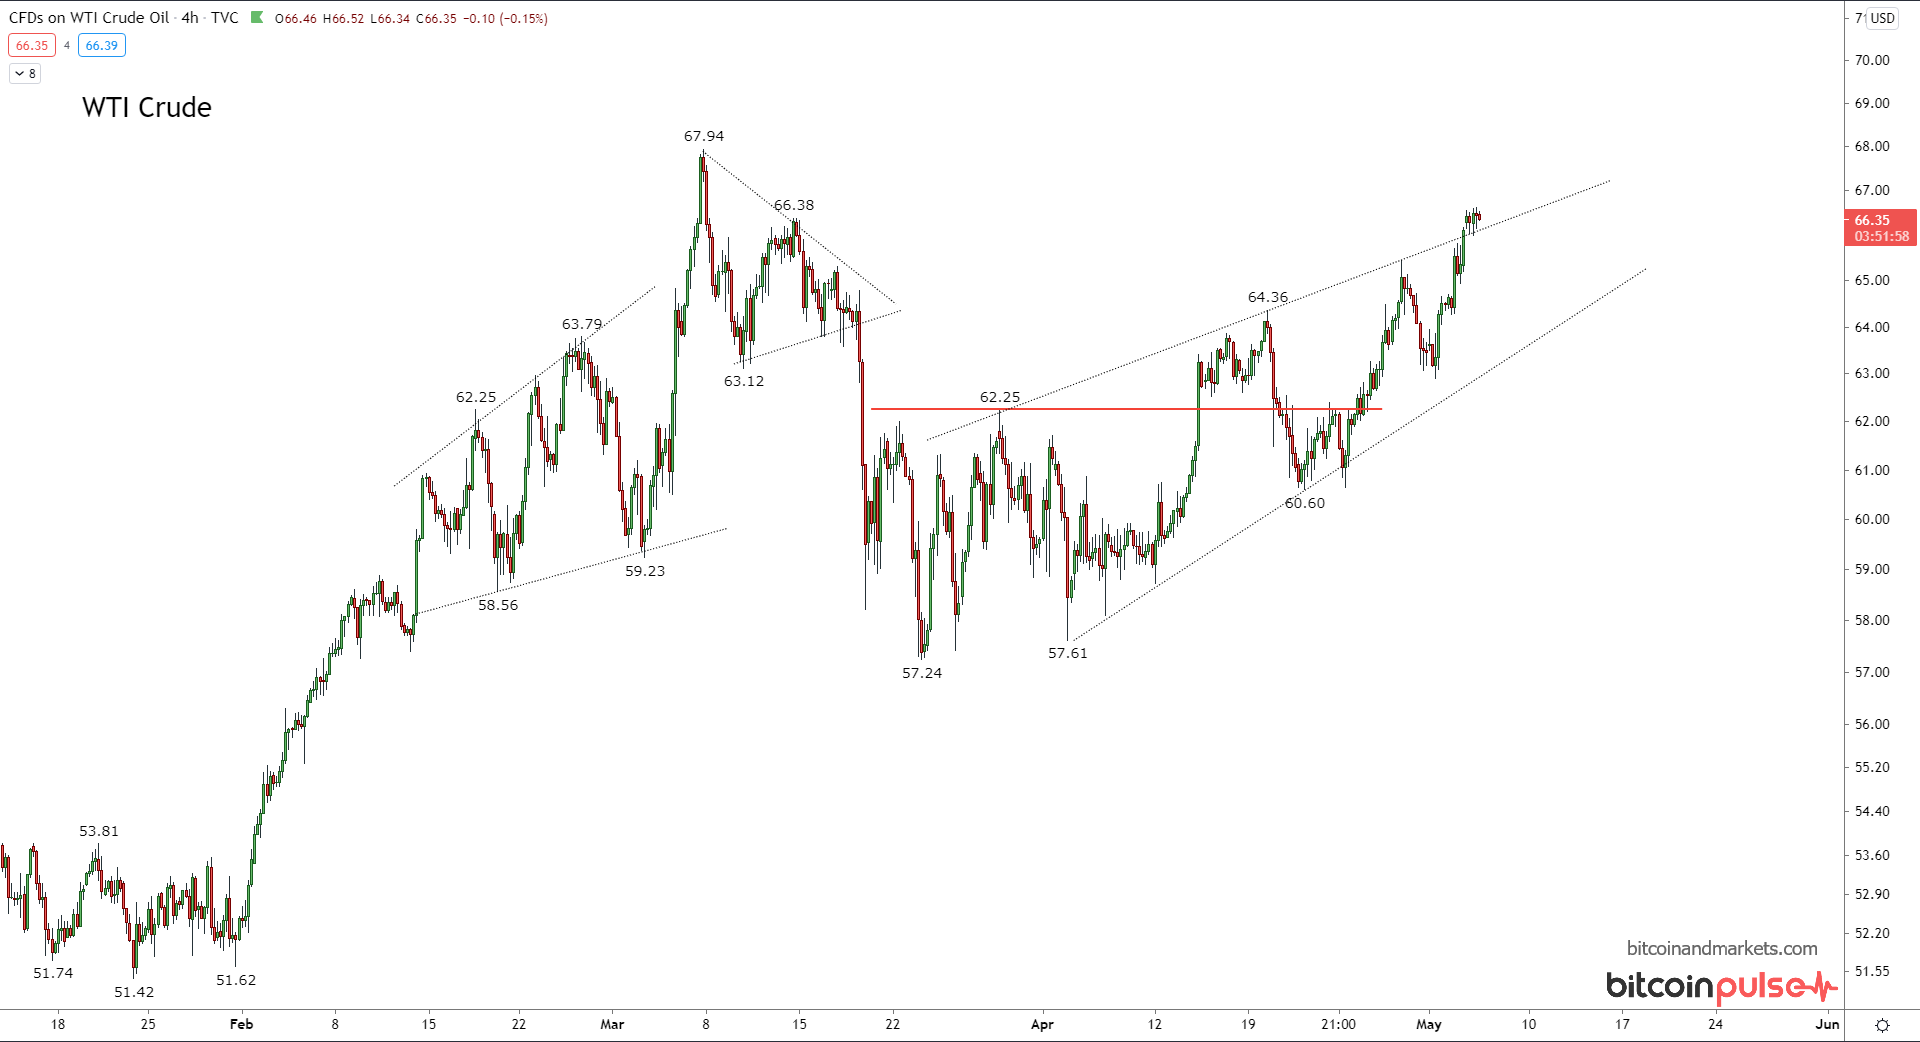
This is pivotal point for oil. As I've been saying, oil in the $60s is where US shale production will start rushing back on the market. OPEC knows this and doesn't want that to happen. In their next move in the grand chess game, OPEC now is scheduled to increase output by 2 million barrels per day by July.
Crude oil production from the OPEC+ group is set to grow by over 2 million bpd over the next three months to July.
Global output is a mixed bag, some countries are slightly expanding production while other are cutting. A good example is the US and Canada. The US expanded rig count this week by 2 for a total of 440 oil and gas rigs, while Canada decreased by 4 to 51 (is a still a large increase of +24 in the last year). This pattern repeats across the globe, some increases and some decreases; except for OPEC. They are ready to increase production.
In the short term, oil could rally, but prices should not go significantly higher any time soon. I still expect price not to remain above $60/bbl for long.
Stocks
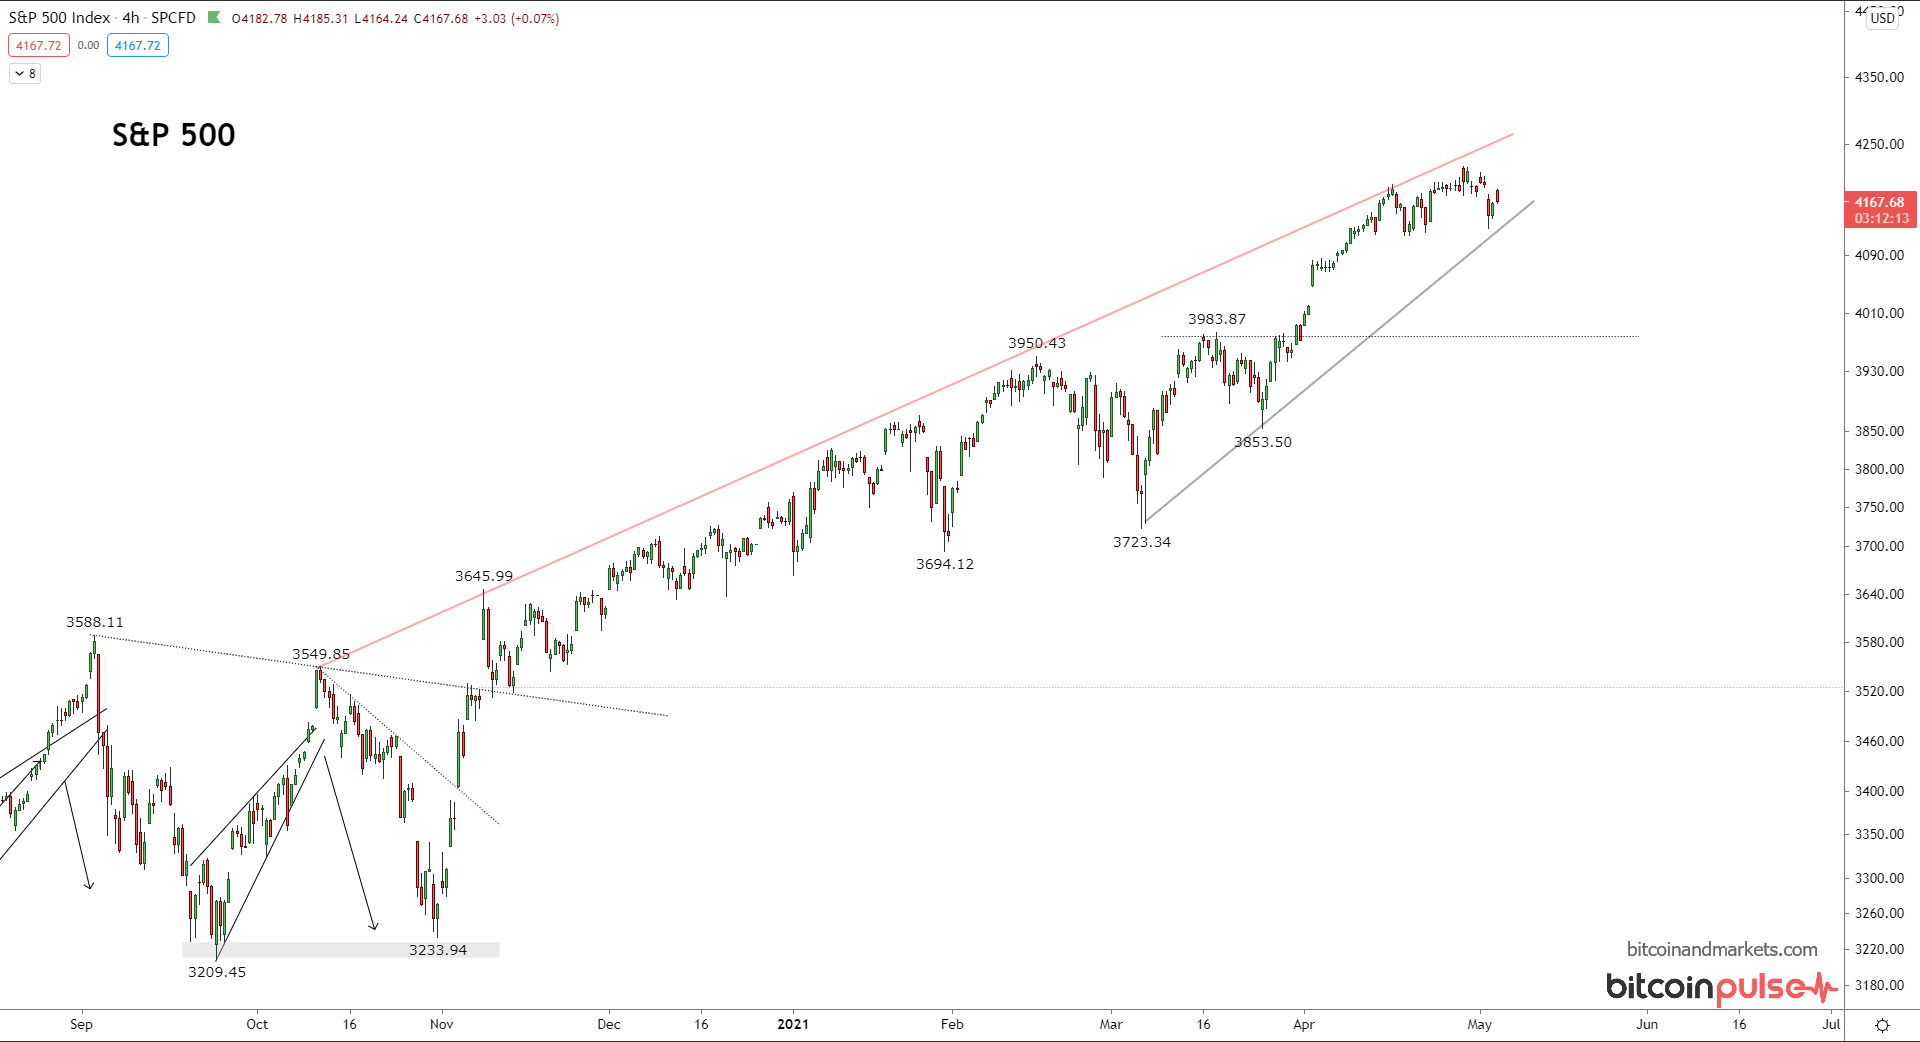
Taking a look at the daily chart for the S&P 500, things look just fine. No imminent price movements are apparent. There is some room to come down and test some lower levels, and if that happens it does jeopardize the overall structure of this recovery.
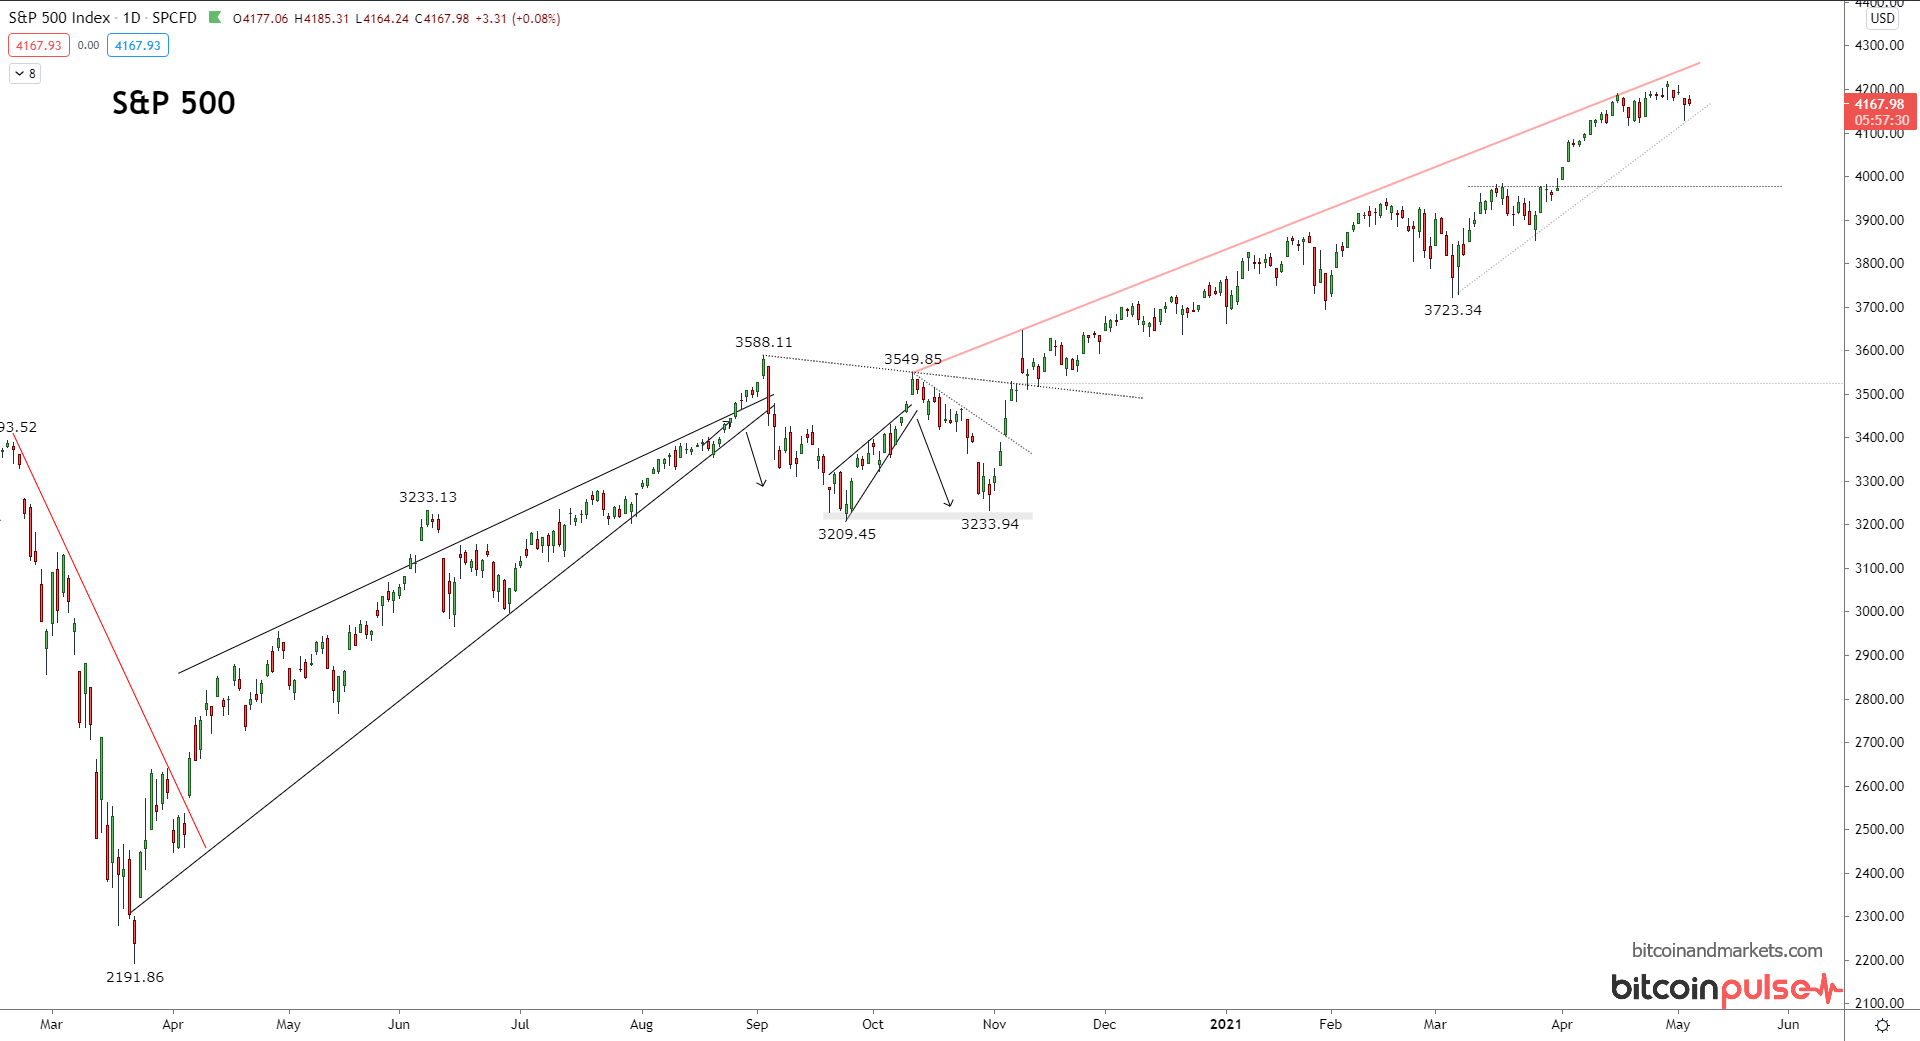
I am expecting some weakness in stocks due to three factors, 1) a double dip of the recession as we've pulled forward most of the year's consumption already, 2) the good old "sell in May" mantra, and 3) stocks are at record deviations above long run moving averages. All these things say there should be a consolidation soon.
I am bullish on US stocks with a health dose of respect for 'No pain, no gain" in the short term. This summer could be sideways to down, but in the long run, structural deglobalization and foreign currency weakness, should put a bid under the US stock market.
Commodities
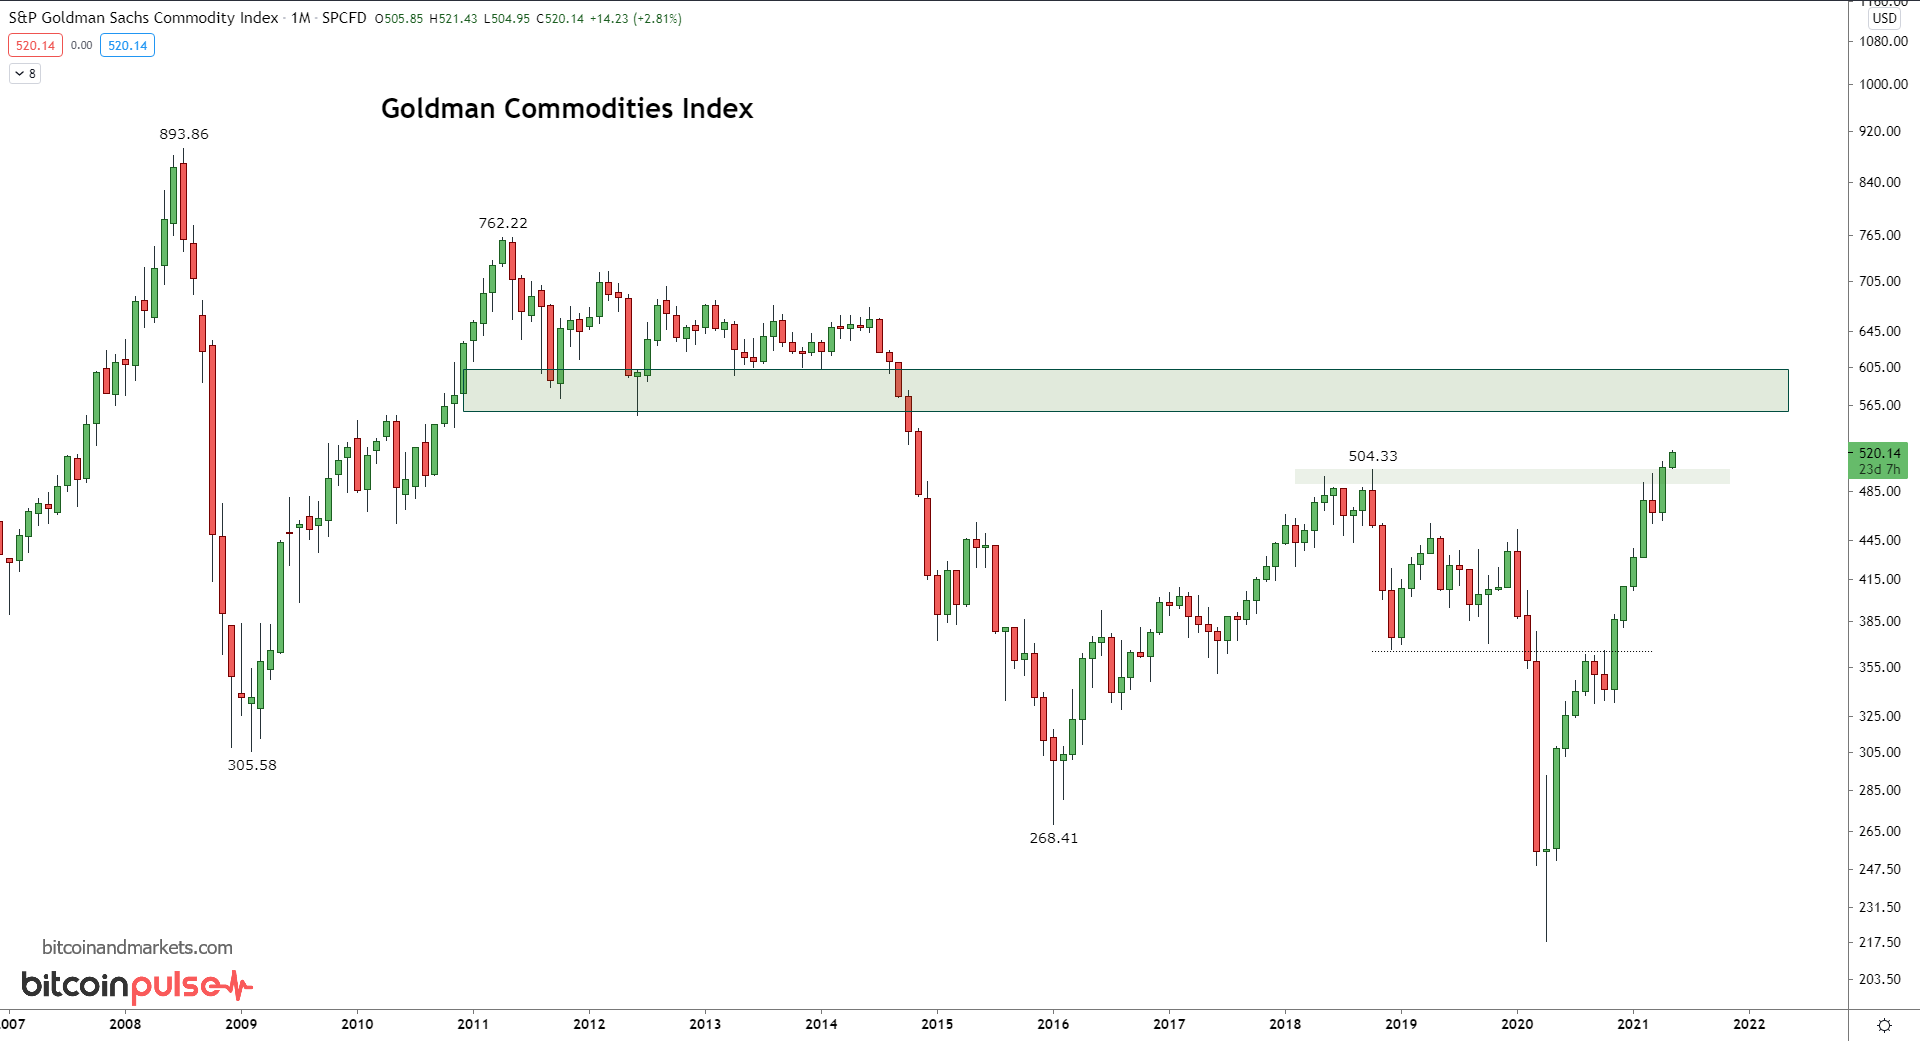
The commodities index has broken out to 6 year highs, something the inflationists are loving as one of the ONLY metrics they can point to. However, the above long term chart puts this move in context. It is significant, I won't argue against that, but it's not earth-shattering. I've highlighted the next region of resistance.
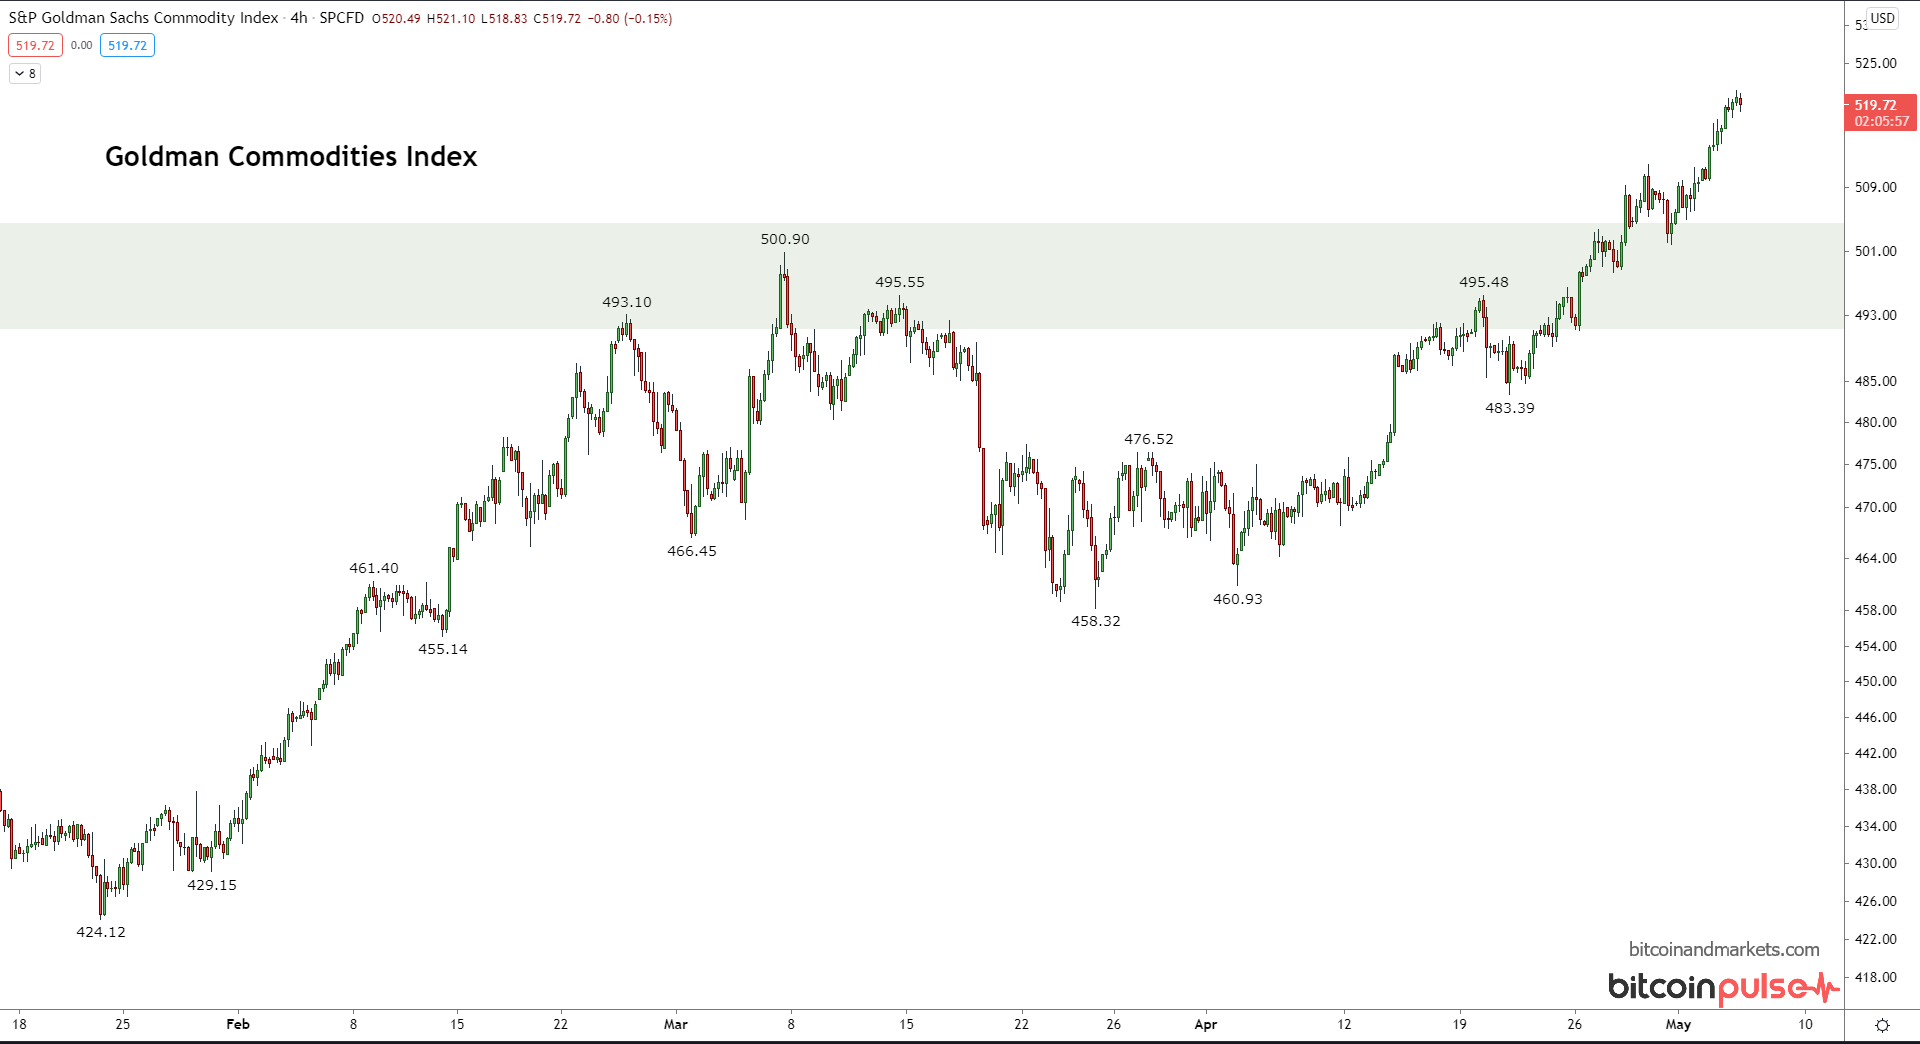
Nothing goes up in a straight line. After a month of a constant march upward, it's about time for at least a consolidation in the commodities. Short term commodities should pull back a bit. Long term, commodities will be weak as the global economy continues to slide deeper into depression and deglobalization.
Gold and Silver
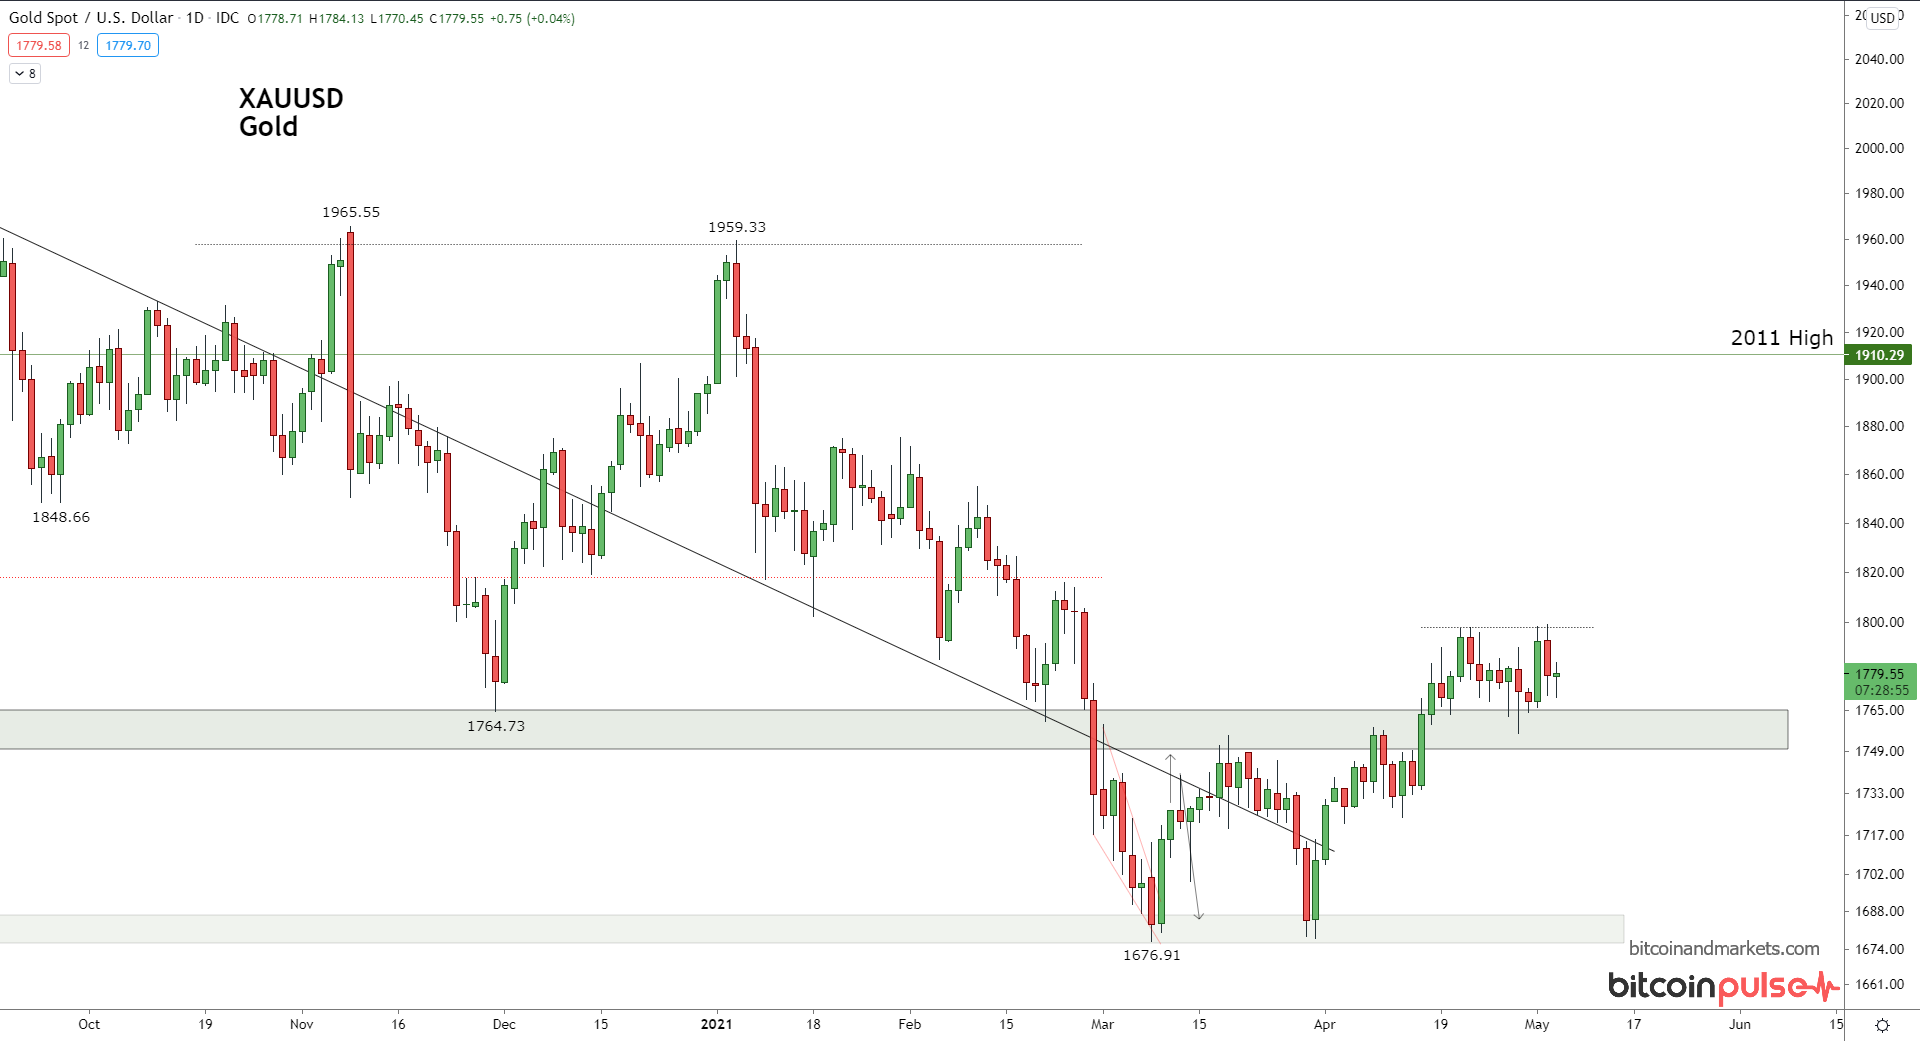
Gold was flat for the week. It is showing a sliver of strength by staying over the important $1750 level, but the longer it hangs out there, without finding more bulls to push up the price, downward pressure will build.
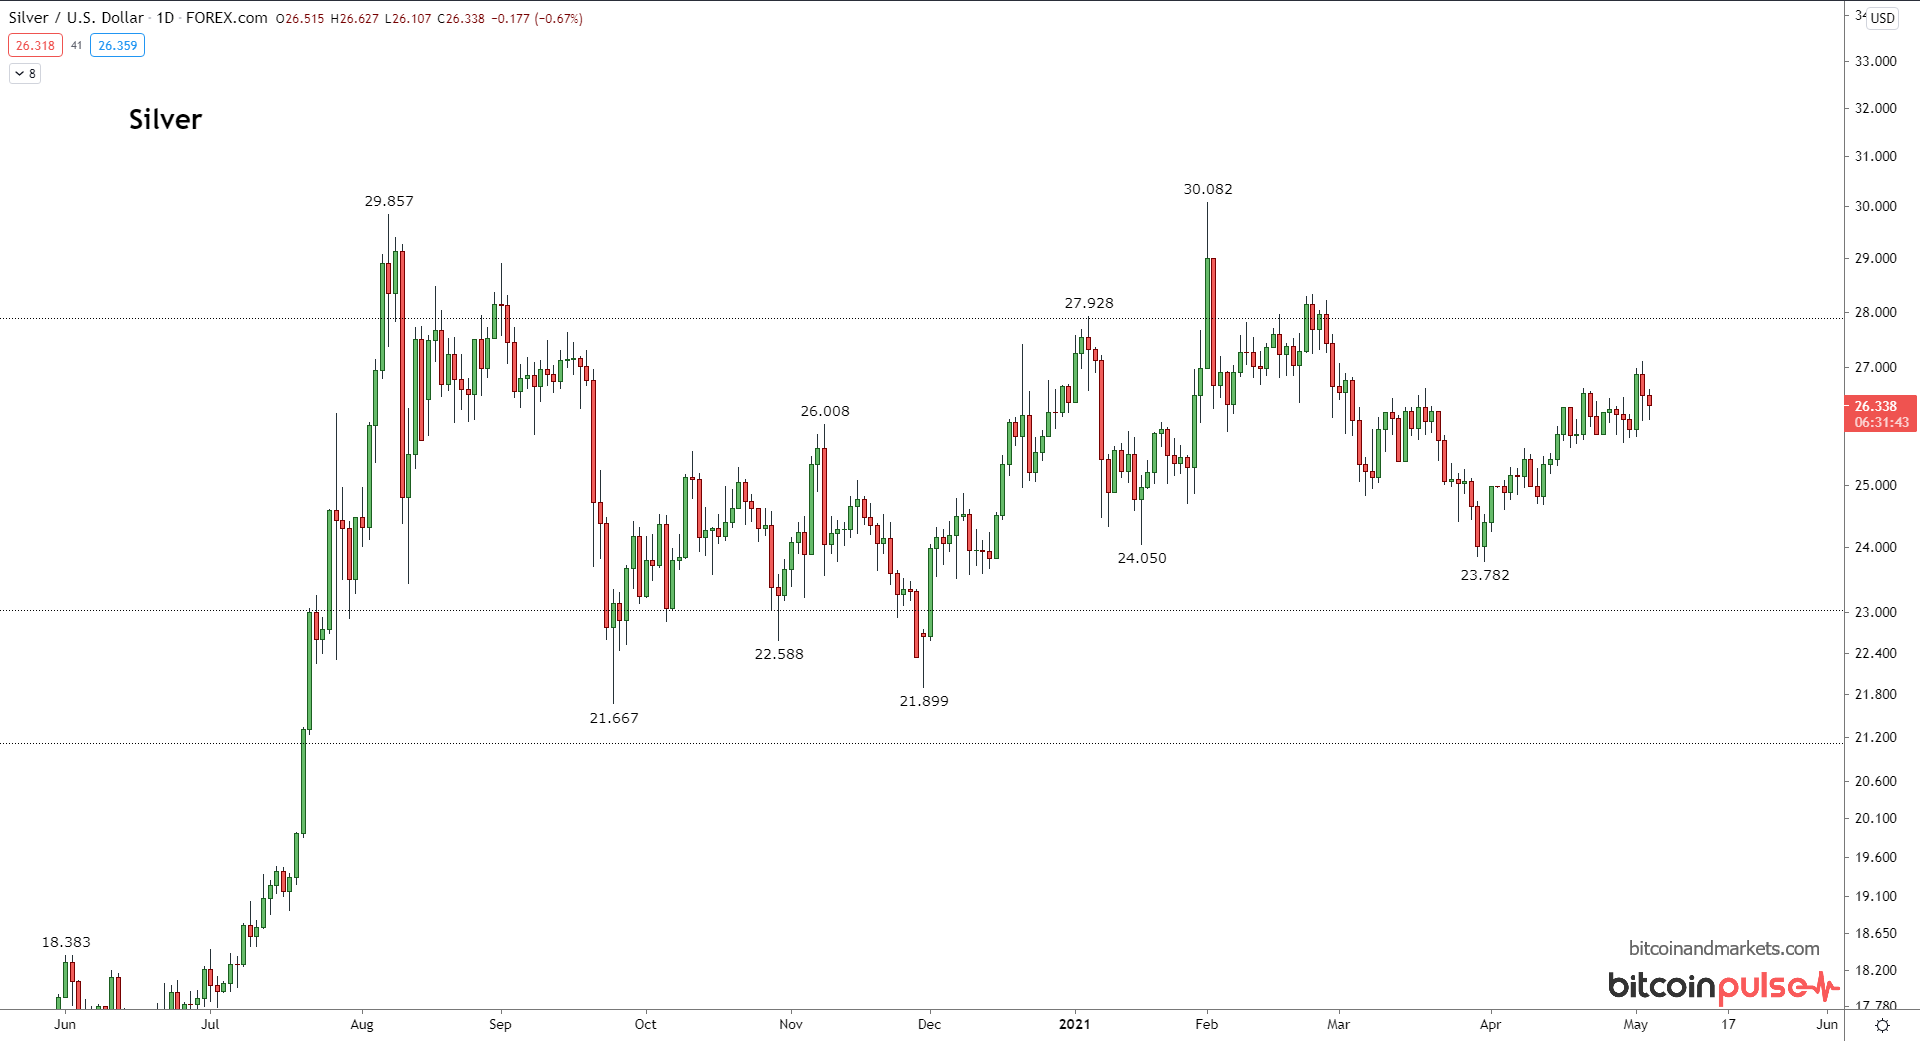
Silver
Silver advanced slightly on the week, but nothing to write home about.
Thanks for read. Subscribe and share!
A
Enjoying these posts? Subscribe for more
Subscribe nowAlready have an account? Sign in