Macro Chart Rundown for 6/14/2021

Welcome back to BTCM Research. Please subscribe if you are finding these chart updates informative. Today, we examine charts for Bitcoin and Ethereum, then move onto the Macro stuff, the dollar, gold, Treasuries, CPI, and oil.
Bitcoin
Reports of #bitcoin's death have been greatly exaggerated. - Mark Twain
— Ansel Lindner (@AnselLindner) June 2, 2021
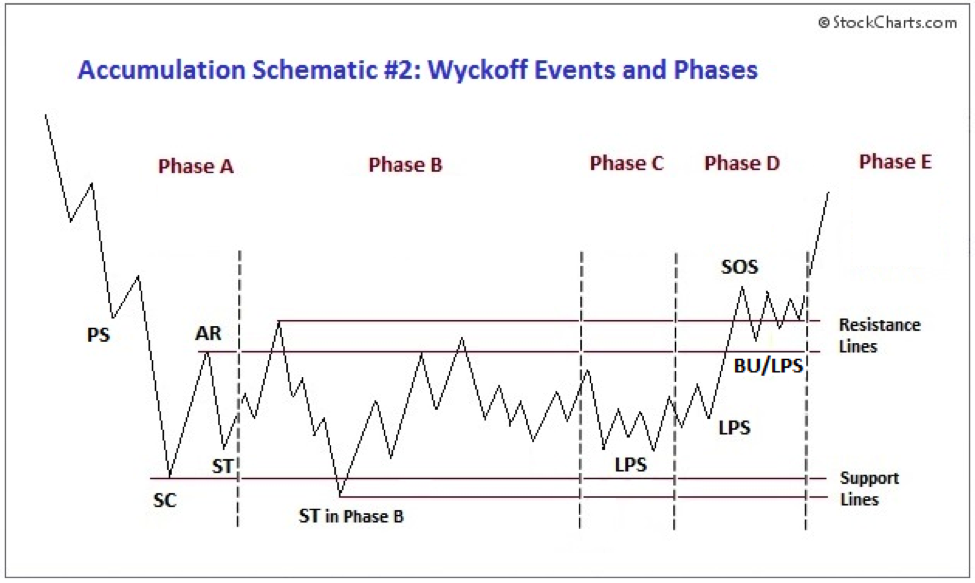
Bitcoin's bull market is just fine. This was a large detour, but it is about to get back on track. It has broken out of its consolidation pattern that is a very nice textbook Wyckoff accumulation.
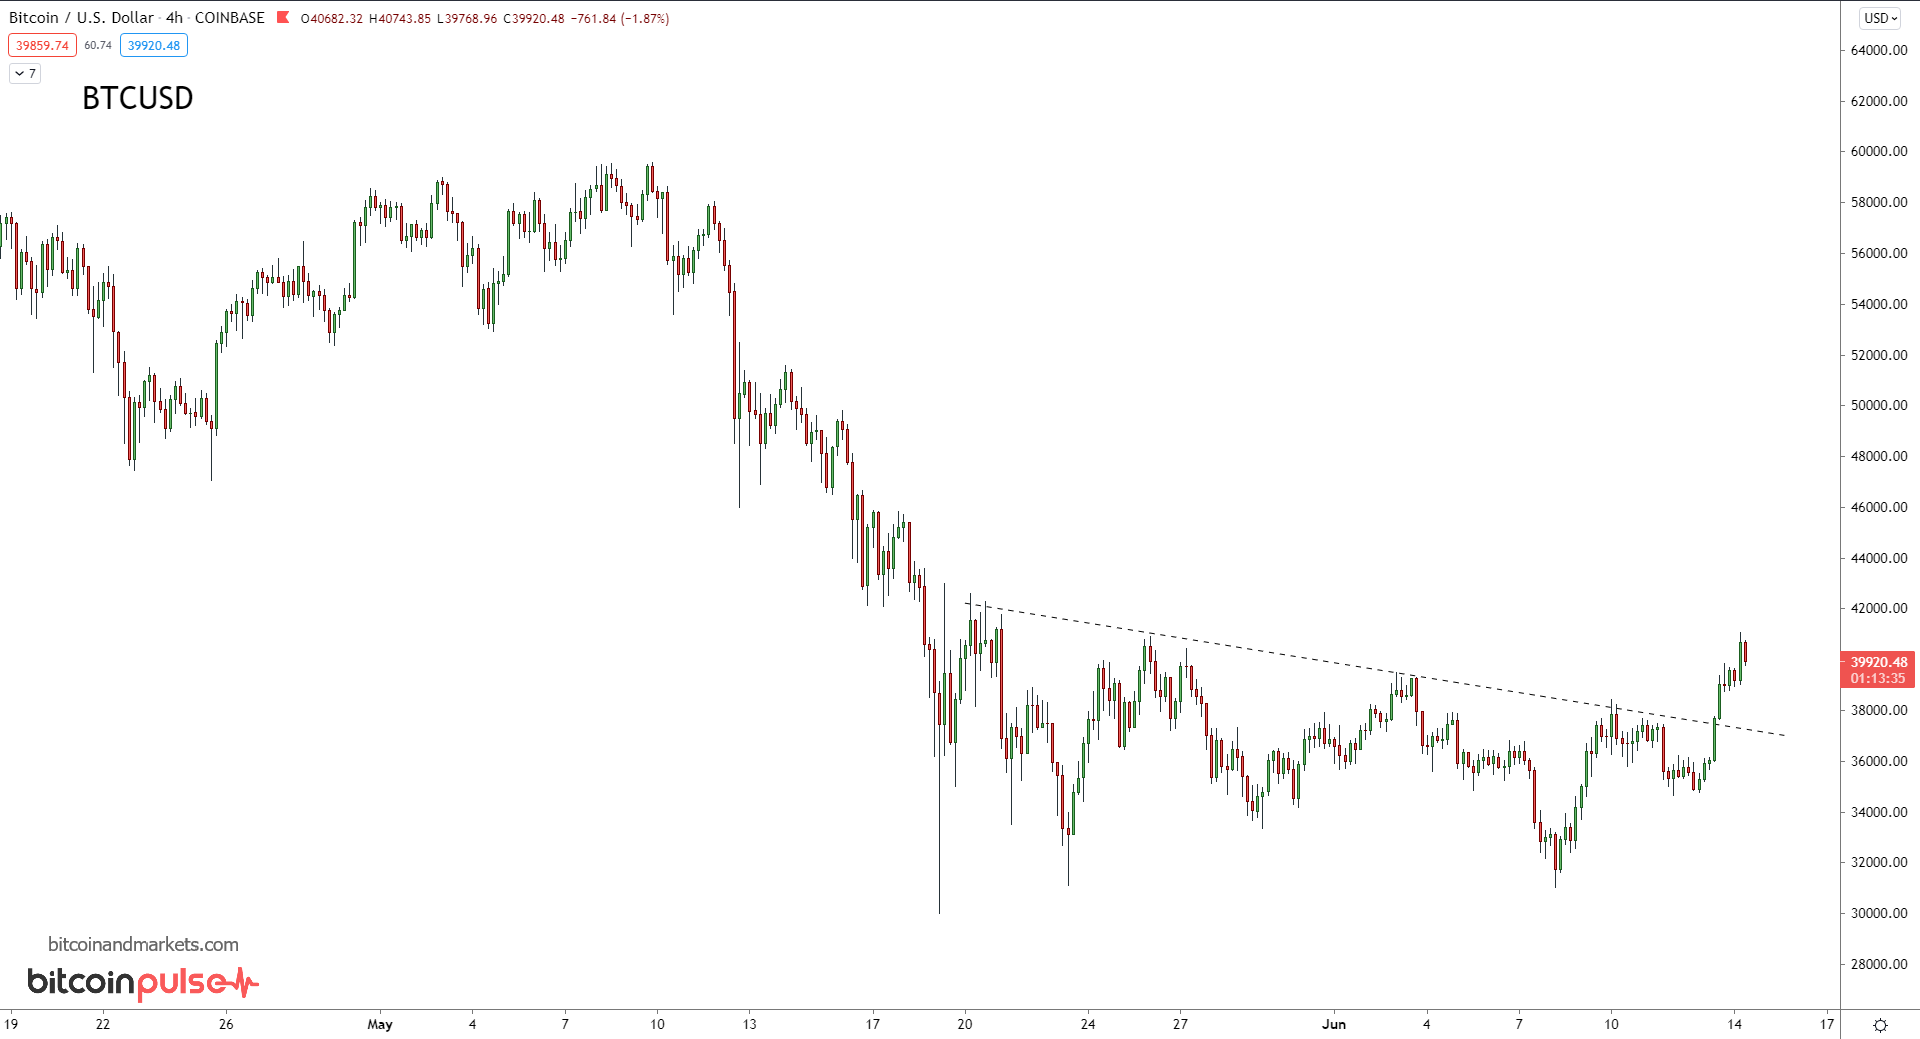
Wyckoff Accumulation
The next chart is much more busy. I walk through all the things on this chart in my Bitcoin Pulse on regular basis. It really is very simple oscillators, moving averages, and fibonacci retracements.
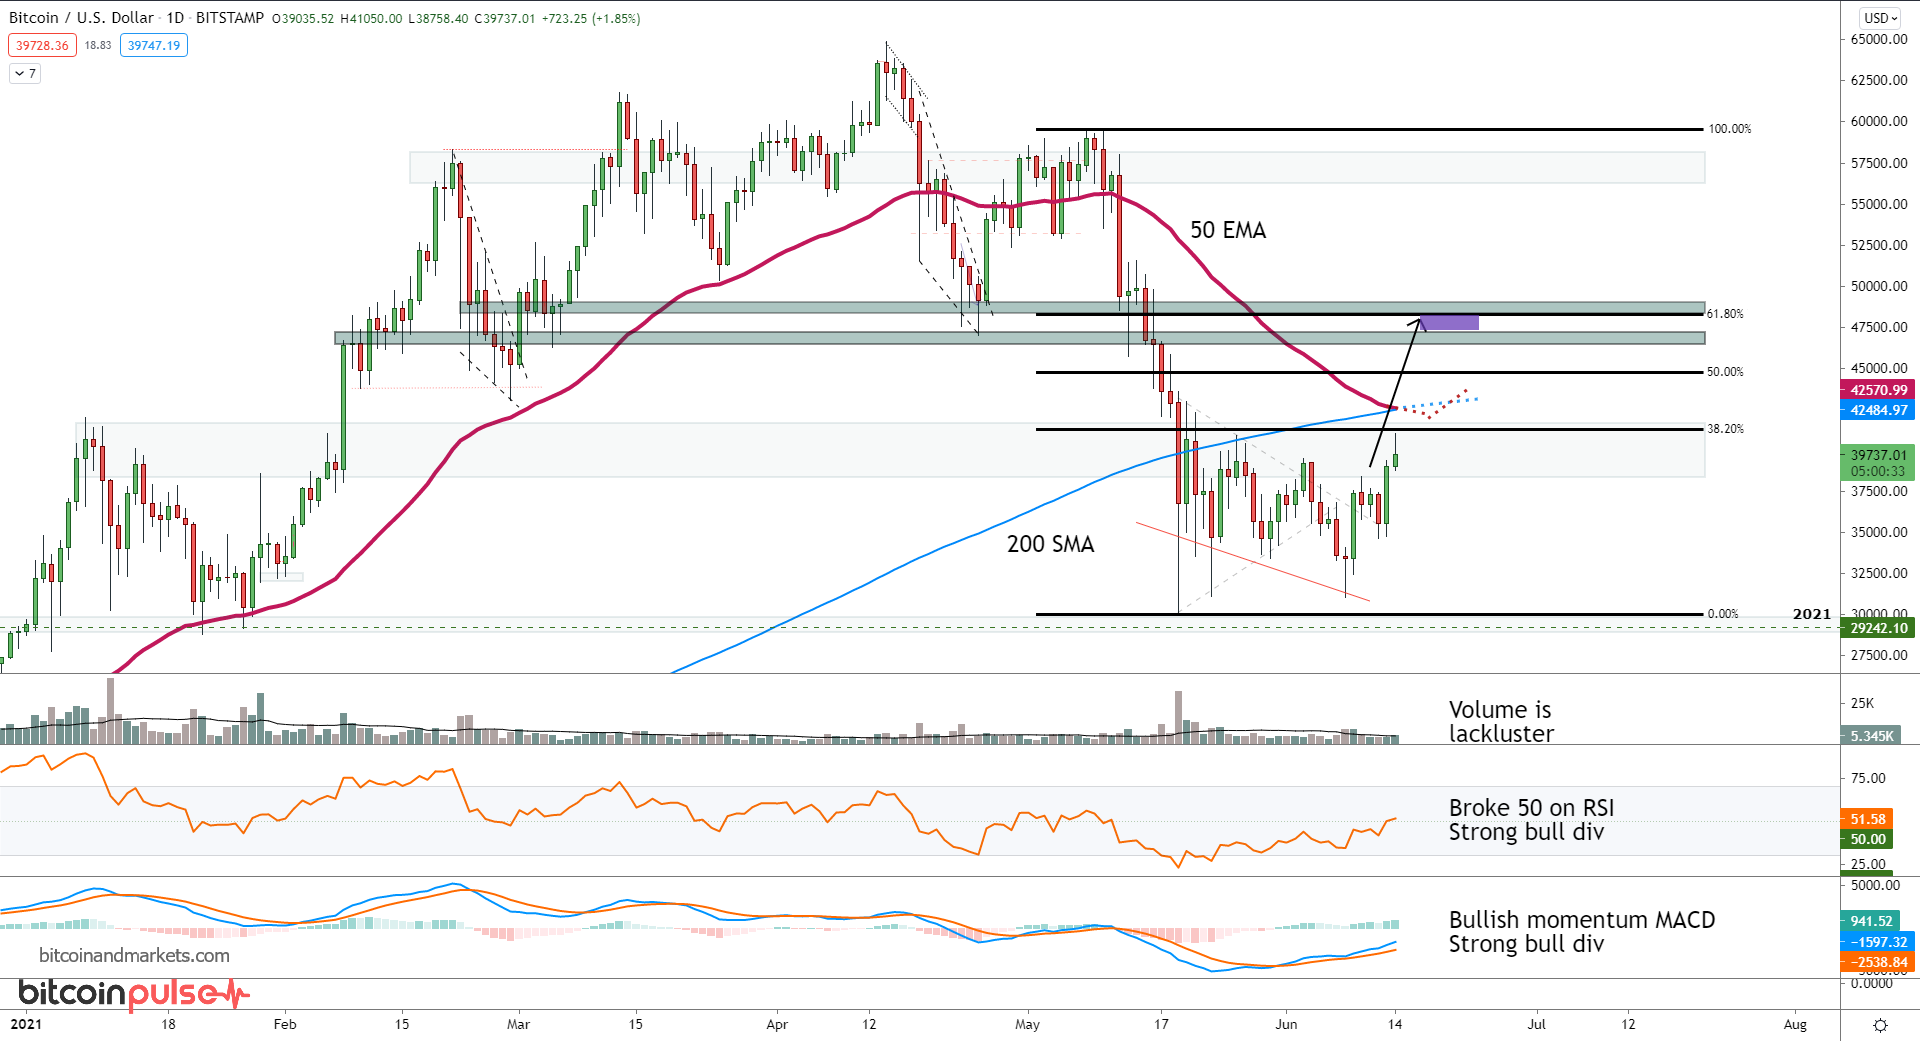
The purple box is my near term target based on a convergence of factors. 1) Price tends to retrace to the 61.8% level with a high rate of accuracy. 2) That also corresponds to prior support to be tested as resistance. 3) The Ichimoku cloud with bitcoin settings has a daily cloud cross at in that exact area, which is an area of lower cloud power and acts as a magnet for price. 4) The 50 EMA/200 SMA cross along that path would match with prior TA as being a magnet. 5) The strong bullish divergences in the oscillators (lower candle close with higher low on oscillator). 6) General bull market bias.
The only factor that is making me hesitate here from being extremely bullish is the volume. The volume has not picked up as I would have expected. Perhaps that will come in later as price marches upward, but it's something to watch out for.
(Note: I use simple Technical Analysis indicators because they are the most used by other traders, they have more of a self-fulfilling prophecy quality. I do not believe that lines on a chart have any particular power to move the price, but as herd animals, vulnerable to market psychology, the work. Also, complex trading bots are programmed based on both simple and complex indicators, but the complex indicators are built up from more simple ones. So, the simpler the more clear the signal in my opinion.)
Ethereum
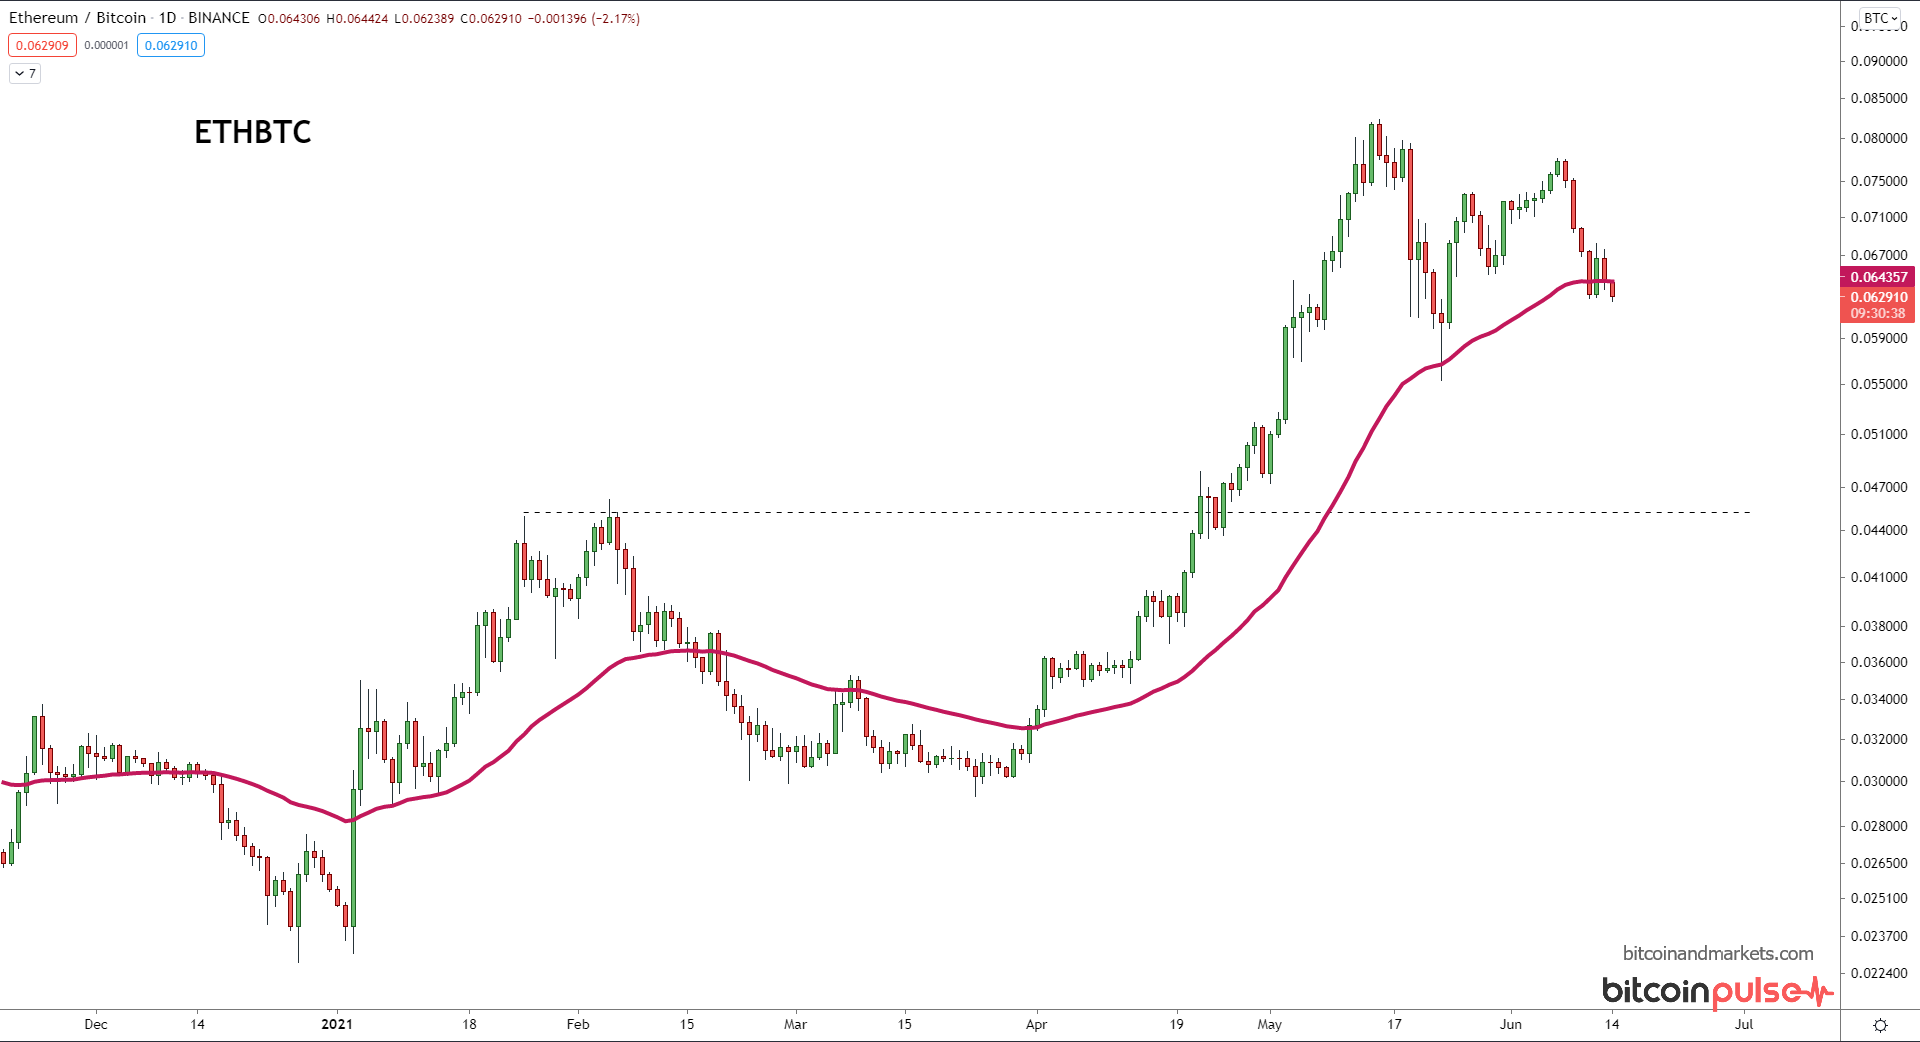
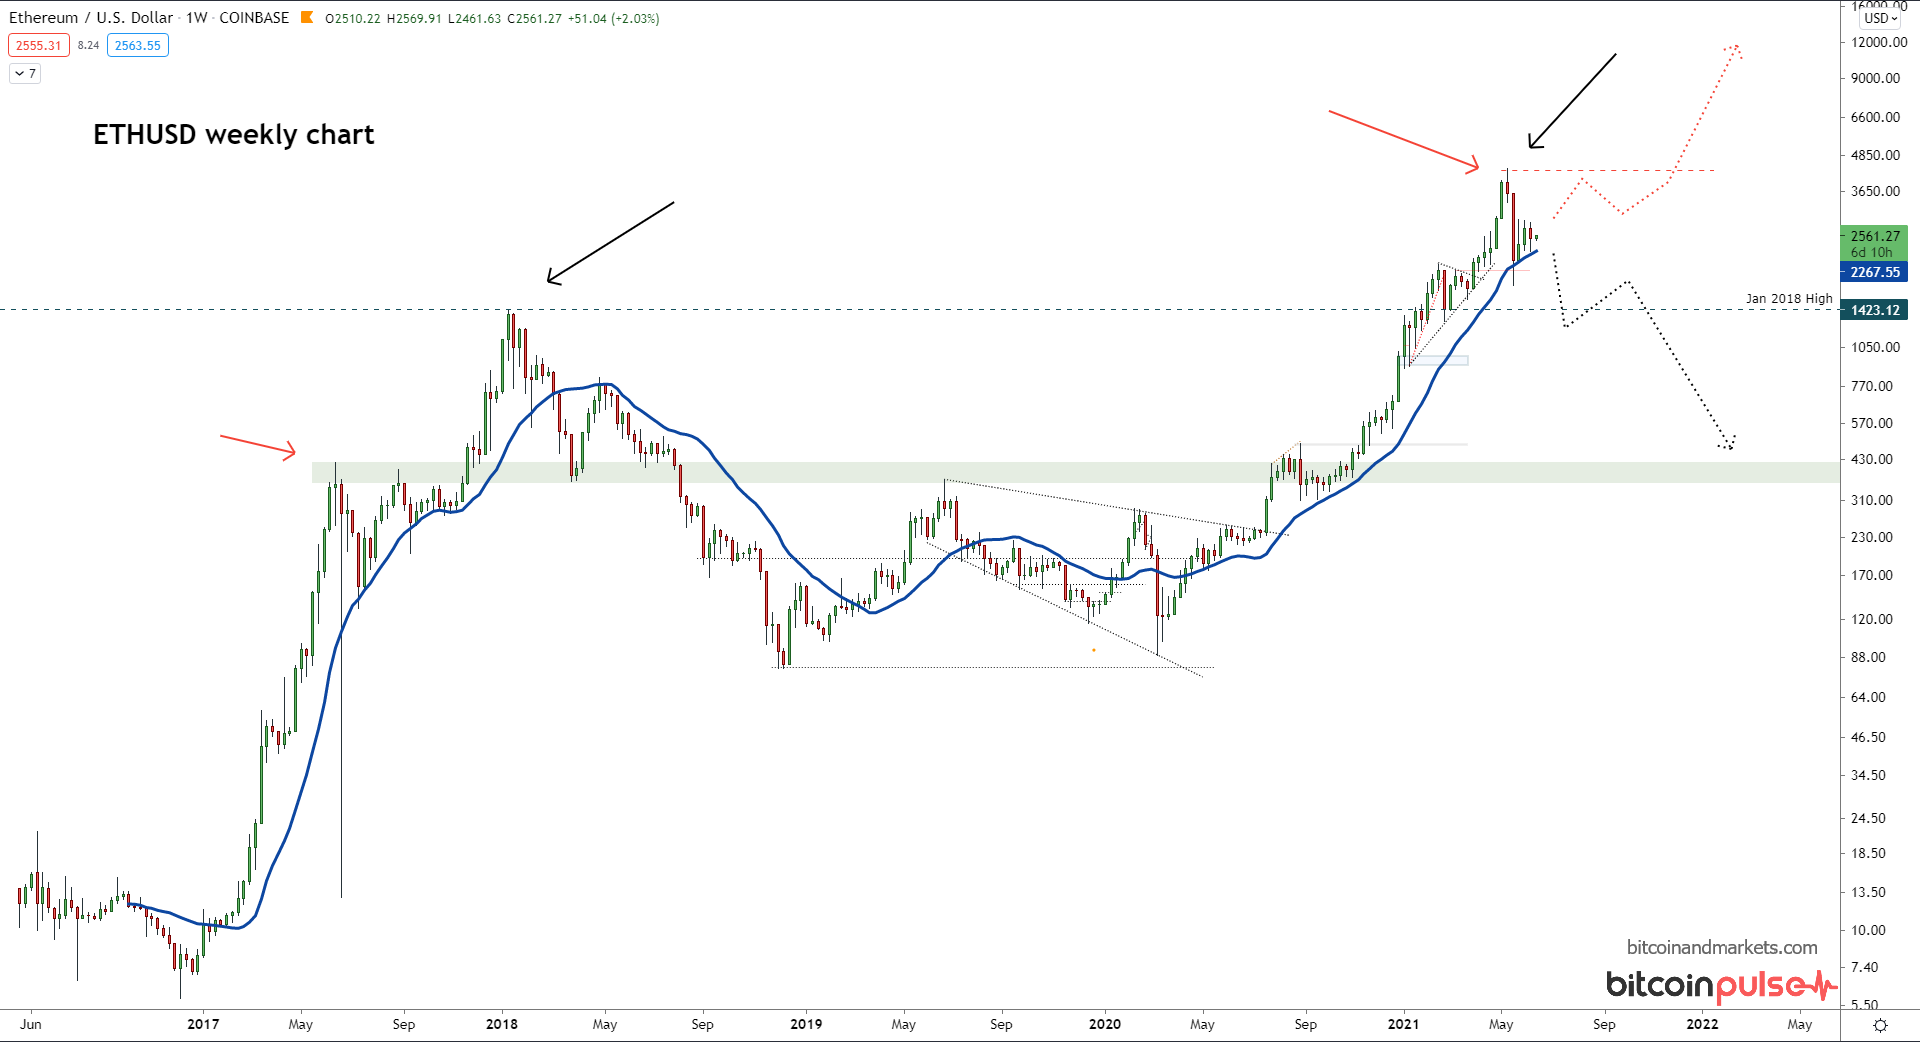
The daily ethereum chart is closing below the 50 EMA which exposes the lack of any support down to near the 0.045 btc level.
On the most recent Macro Chart Rundown back in May, I pointed out the pattern in Ethereum where it pumps in the first months of the year, every year. This pump was very big back after the 2016 halving, where it ran from the start of the year until mid-June.
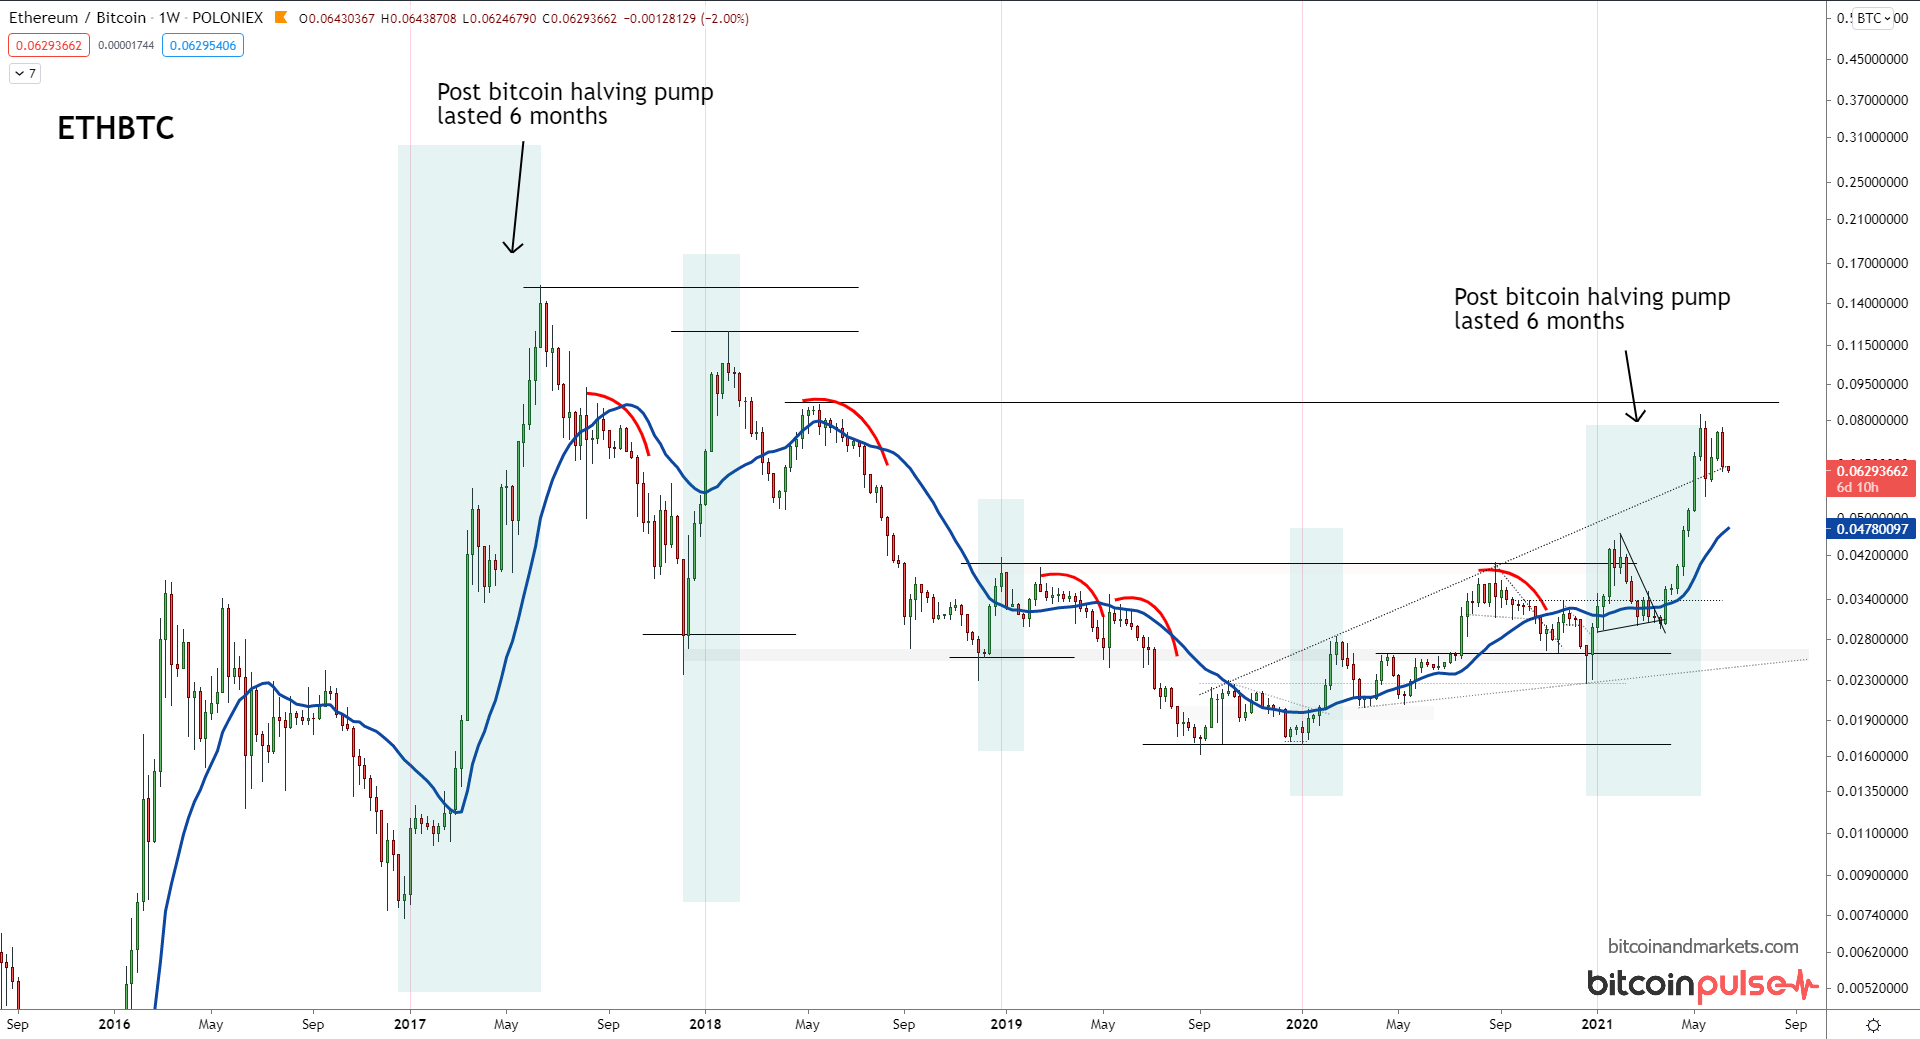
This 2021 post-halving pump is strangely similar to 2017. It has run from the beginning of the year to mid-May, and has held on into mid-June. The mechanism behind this pattern in unknown, circumstantially it seems to be related to the bitcoin halving. Bitcoin's 2nd halving was in July 2016, compared to the 3rd halving which was earlier in the year in May 2020. When added to the fact that the top of this Ethereum pump was also earlier this year (May 2021 vs June 2017), that is interesting circumstantial evidence.
It is likely a very simple story. For instance, it could be that the halving creates a media/news cycle that altcoins are able to latch onto. Being that they are unable to create their own buzz, they must wait for bitcoin to kick it off with the halving. Then, since altcoins are relatively much more illiquid than bitcoin, they will increase in value relative to bitcoin during a mania, but also crash much more relative to bitcoin when that wears off.
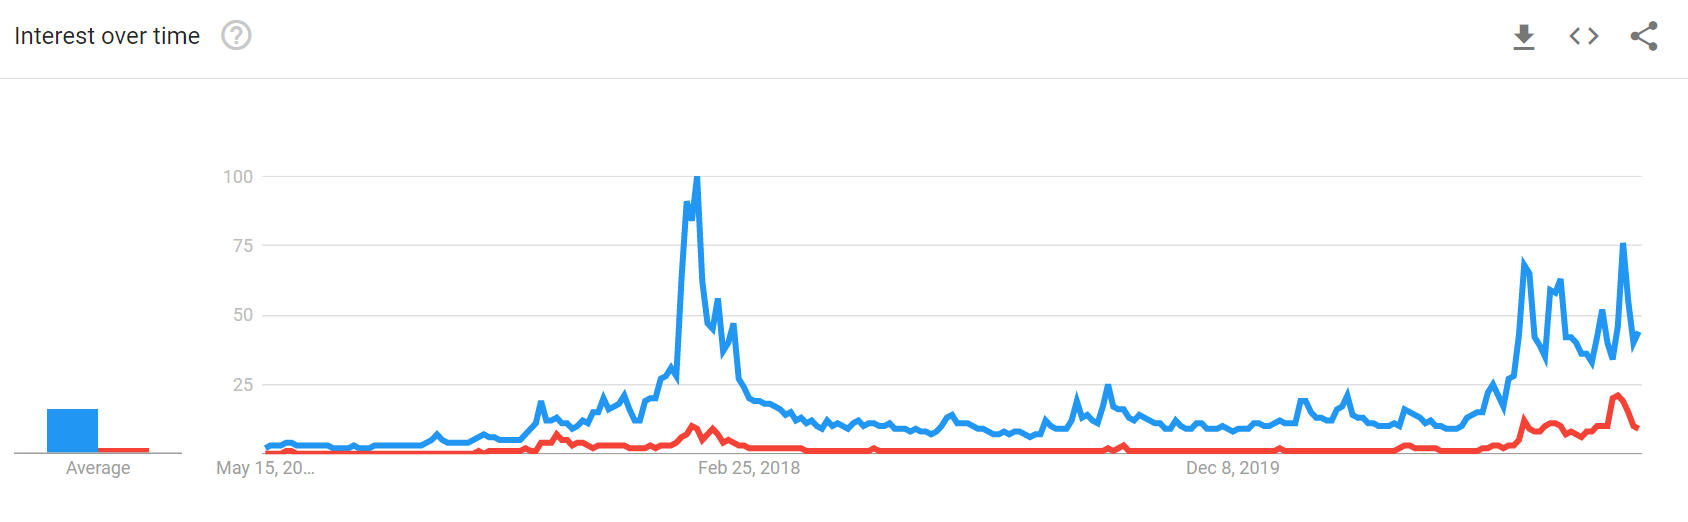
We can see this relationship in the Google Trends search data for the term "bitcoin" vs "ethereum". Ethereum is near zero interest for years, absolutely no buzz outside the small hardcore "crypto" promoters. There's no grassroots, independent interest for ethereum.
I expect ethereum to continue it's slide vs bitcoin throughout the rest of the year. It is a pink fluffy unicorn with no more than $1 bn in legit, productive, sustainable value. I expect this bust cycle for ethereum will take it back under $500, and probably lower.
Two quick scenarios on the USD chart. The red scenario if we consider the recent peak is like the peak at the red arrow on the left. This scenario would mean another rally is coming in a couple months. For that to be the case, we'd need to see the price stay above the 20 week simple moving average and press the recent high. However, the black scenario is more likely, that being that this recent peak is similar to the previous cycle high. A break and close below the 20 week MA would signal this scenario.
Okay enough Ethereum garbage, let's get into the main Macro stuff.
Dollar
Taking a quick look at the daily DXY chart, we can see the recent bottom has held nicely and it is pressing against the 50 EMA. Breaking the 50 EMA will be a show of strength at this point, because it will go against the death of the dollar narrative; at least the dollar is holding steady.
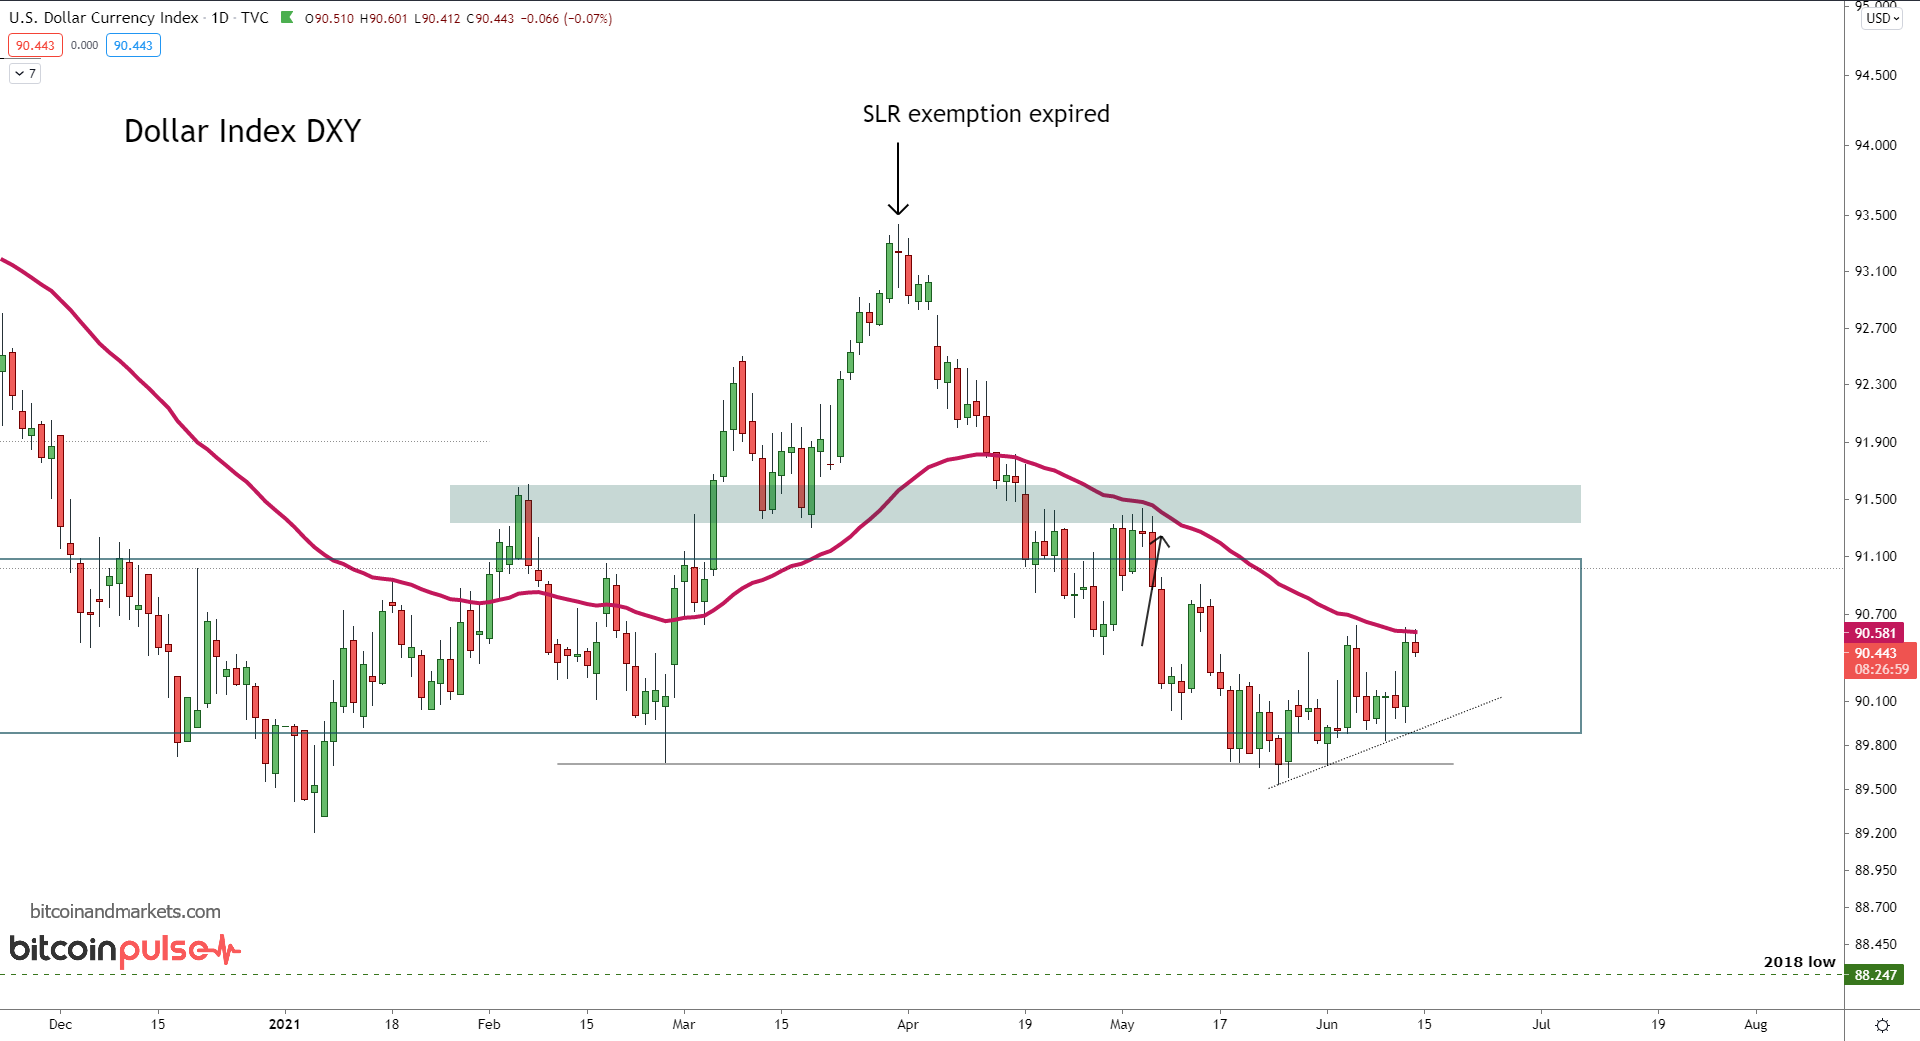
The true level of importance is 91.5 - 92. Once DXY goes above the 92 handle, it could get ugly. The bottom line for the dollar here, is that it's not weakening, it is actually threatening getting stronger.
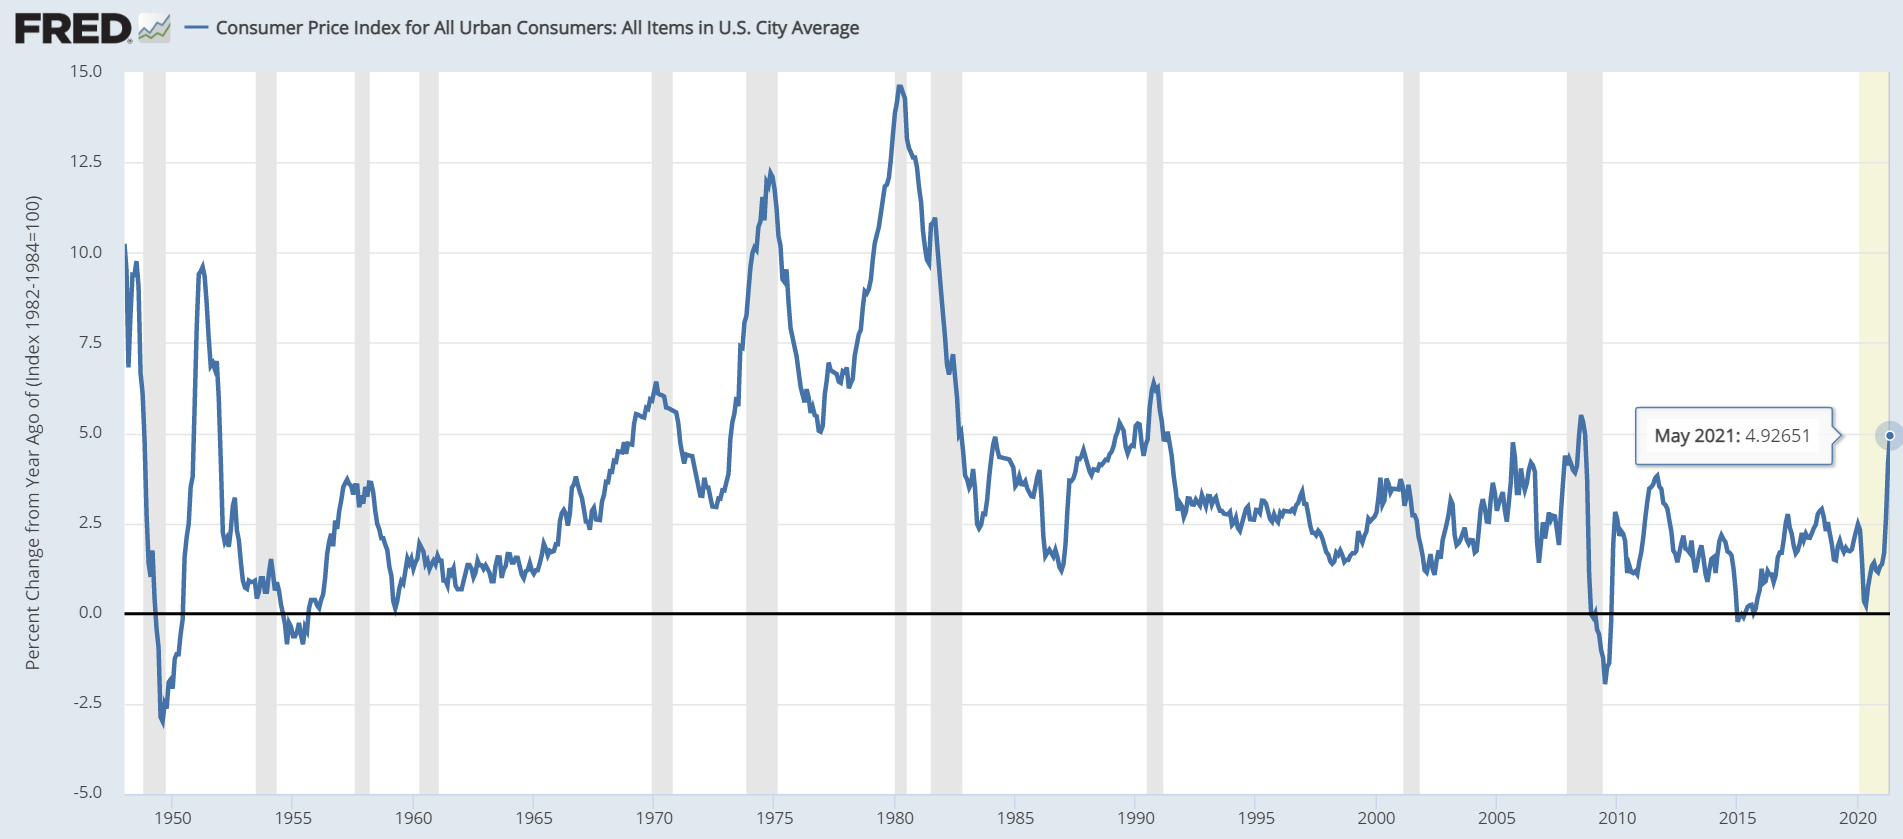
CPI 5% Print?
I might get some push back on that last statement, specifically about the CPI. 'How can the dollar be strengthening if the CPI is showing 5% inflation?'
I wrote a post on this exact topic, you'll want to read that if you a member to Bitcoin & Markets. Here is the relevant part for us today:
The CPI print came out today for May, and it was a banger, 5% YoY. That is not a 5% increase in prices in the month of May, but 5% since last May. That is hugely important. What was happening last April and May? Negative seasonally adjusted CPI and lockdowns.
For completeness here are the numbers:
| Unadjusted YoY | 5.0% |
| Seasonally Adjusted | 0.6% |
| Less Food & Energy | 3.8% |
| Less Food & Energy Adjusted | 0.7% |
| Energy | 28.5% |
I can hear the inflationists now, "See there is massive inflation!!!" Blissfully unbothered that they are relying on the CPI after months of claiming it was useless. LOL This is exactly why we need to define money as an increase in the money supply and look for confirmation in other money markets like lending, yields and repos.
A couple months of 4-5% YoY prints is nothing dramatic, when the previous year it is derived from was literally unprecedented lockdowns and deflation. It means prices are 5% higher than in May of 2020 when we were all in lockdown. This should not surprise anyone! Supply chains are rekt, chip shortages are causing havoc, oil is surging (more on that below) and stimulus has pulled forward trillions of dollars of demand. And only 5% YoY after the inflationists narrative of "30% of all dollars were printed in 2020"!? Wake me up when we sustain 5% for a couple of quarters.
Most likely there will be another big print of around 3-4% in June, based on June 2020 being so low. But by July 2020 CPI jumped to 4%, so by July 2021, I expect the CPI print to be back near 1%. Transient.
The market will reject these higher prices and slow down, but not before they run into bitcoin's waiting arms as an "inflation hedge".
Gold
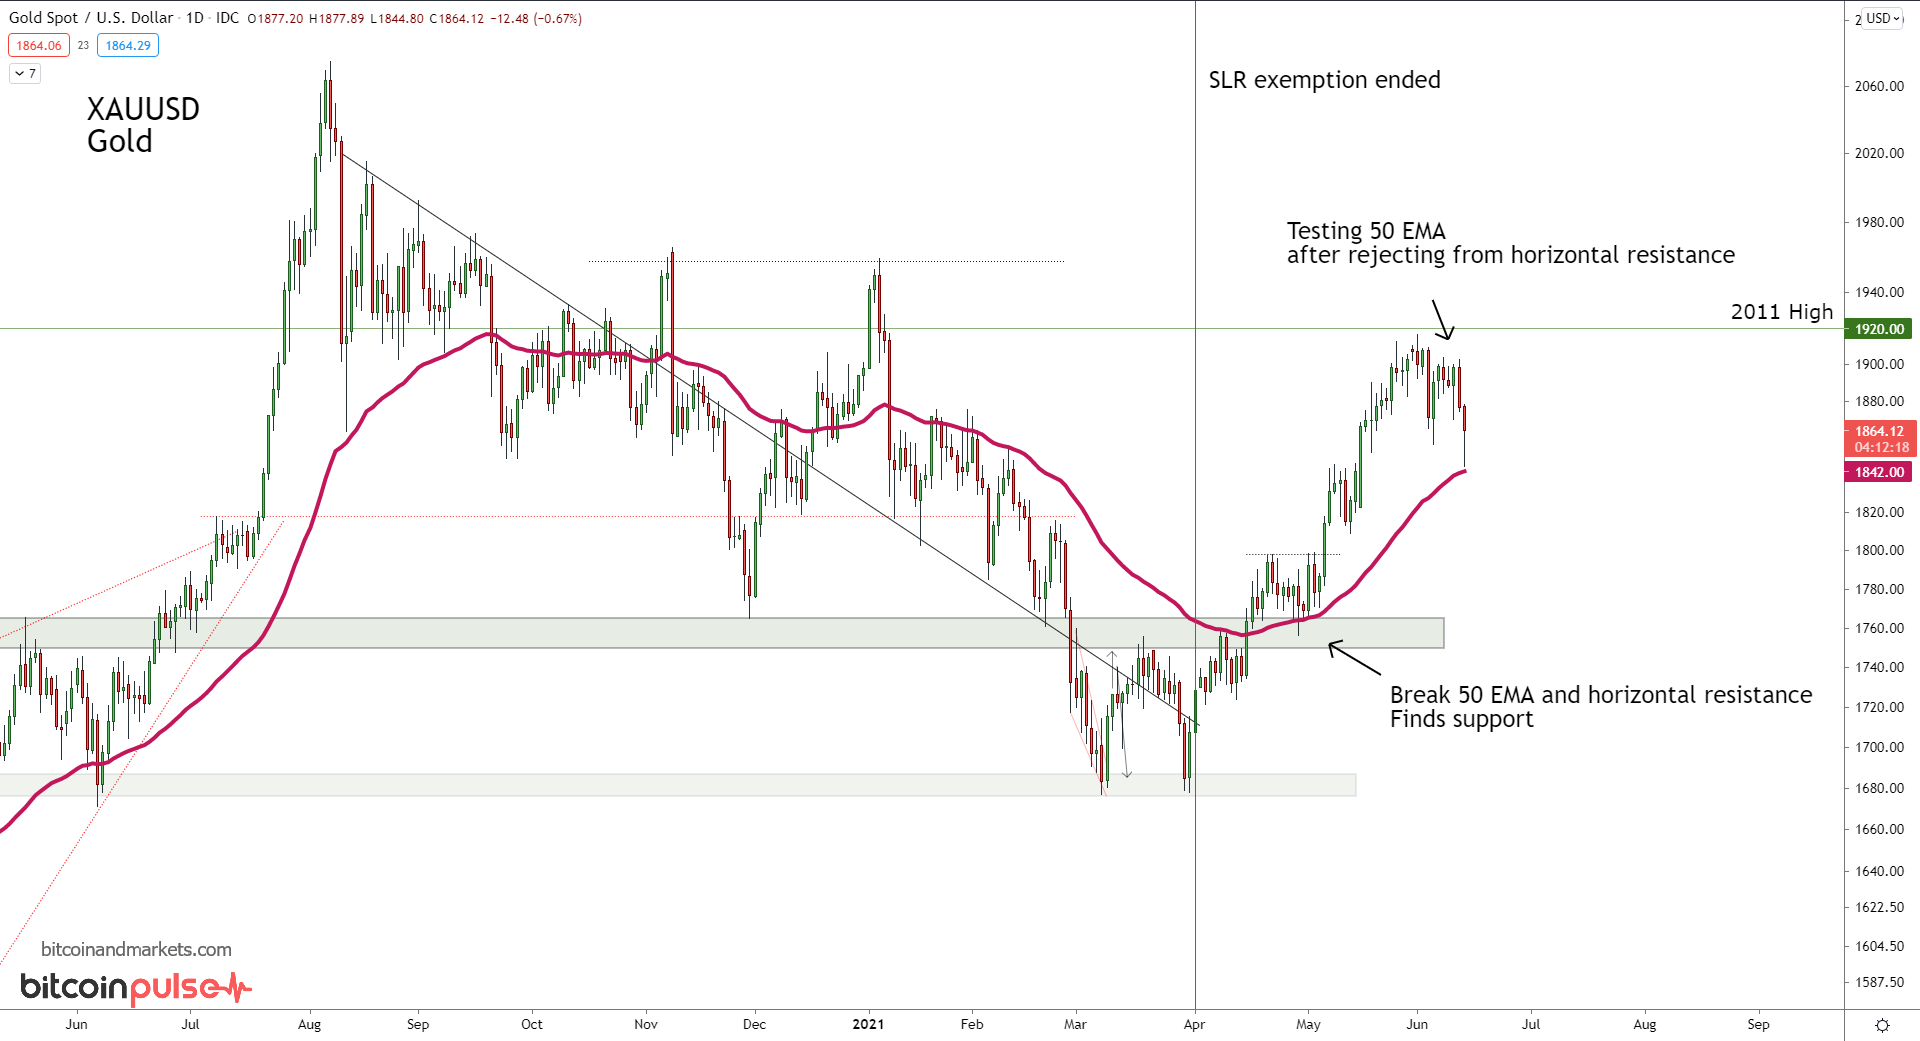
Nothing much has changed for gold. It did rally further than expected, but then as predicted it experienced resistance at the horizontal resistance at the previous 2011 High. Price has now dipped back down to test the 50 EMA.
If gold cannot hold the 50 EMA, I expect it to test far lower, down to around $1780.
Treasuries
Remember, in our thesis here at BTCM Research, money is printed when private credit is expanding and rates are going up. If rates are falling, that means money is getting tighter, not more dovish. It is the exact opposite. As we have seen recently, rates on the US 10Y has gone up as CPI has been going up. Conversely, rates are now falling, so CPI as an inflation proxy will fall.
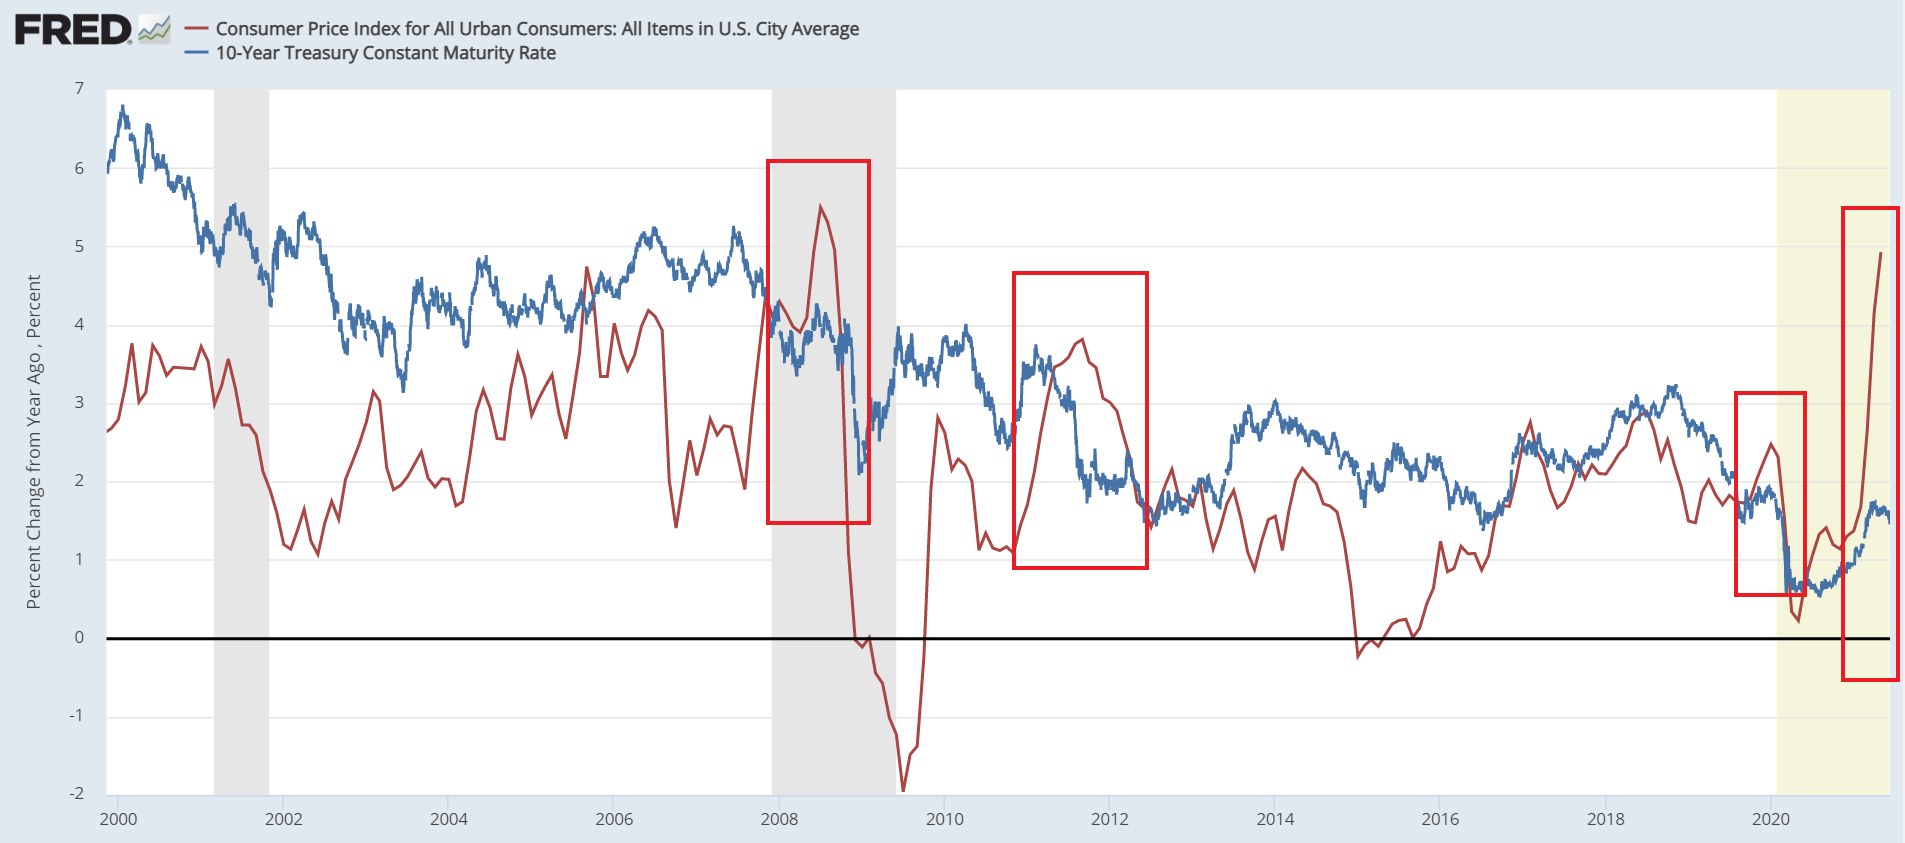
I highlighted all the times since the post-growth paradigm shift in 2008, where CPI (as a proxy for inflation) has appeared to break out and where the bonds didn't buy it, pulling CPI back down (used the US10Y yield here).
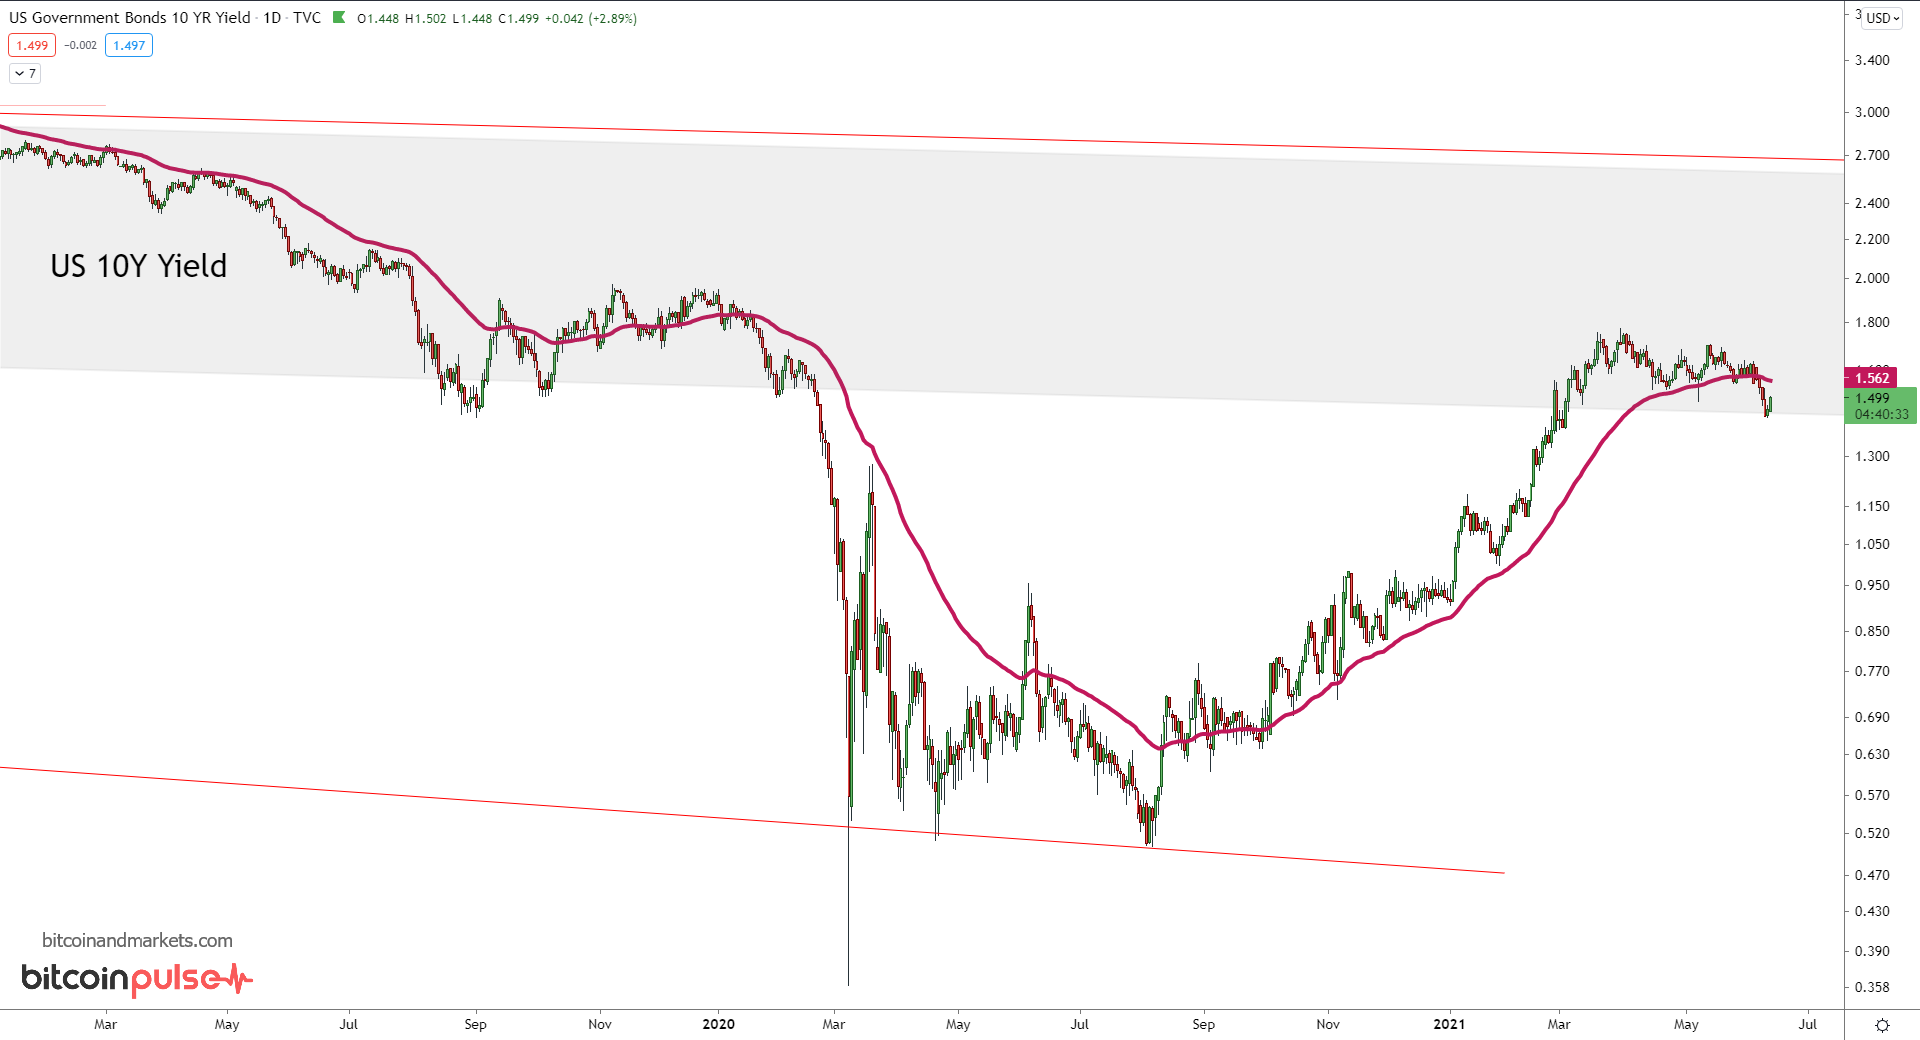
Forgive the log scale here, it becomes evident why I use that on the next chart. But we can see above, that the 10Y rate is rolling over as I've been calling for, for months. It has broken and closed successive candles below the 50 EMA and is really showing weakness here, with lower lows and lower highs on the daily.
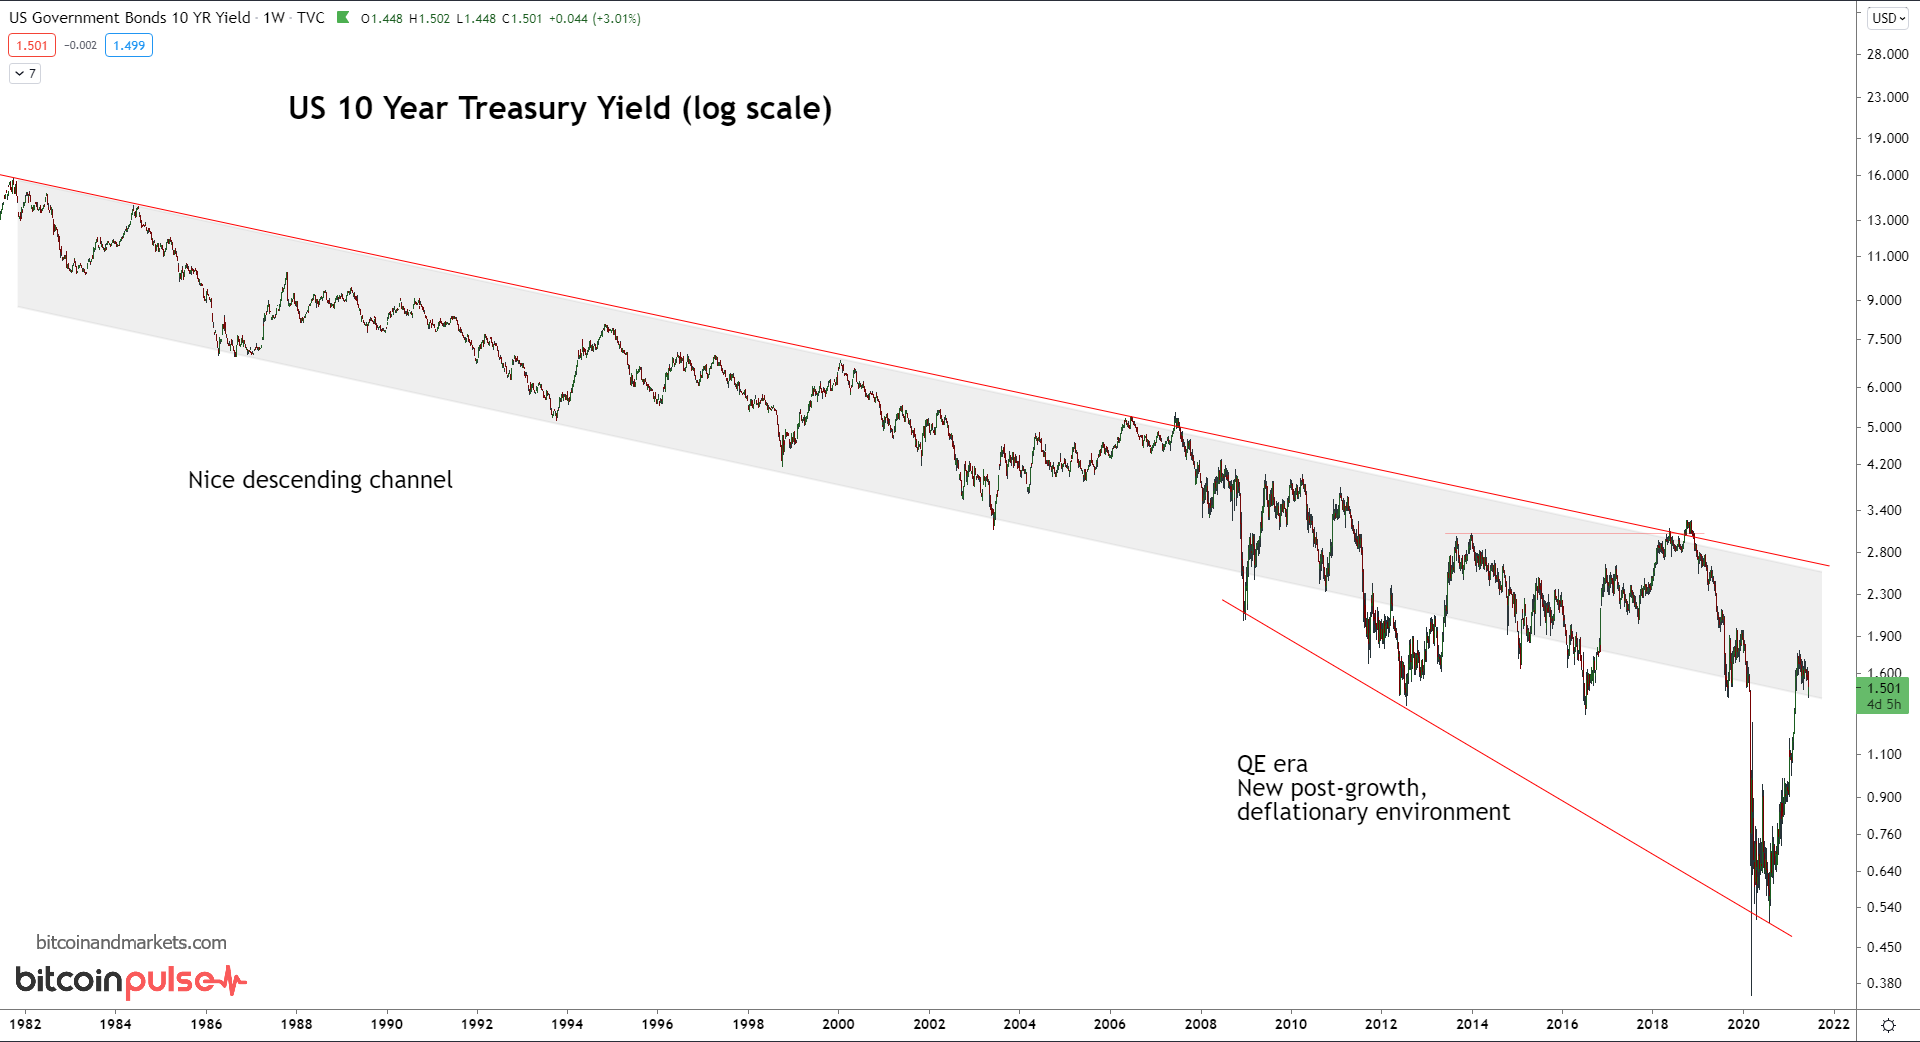
There's a LONG way to go to convince the market growth is back and rates should rise, and credit should expand. Especially, as bailouts (QE is manipulation to stop default and deflation) keep bad debts and misallocated capital in place. I'd consider myself proven wrong if the 10Y rate gets above 2.5% and breaks out of this channel to the upside.
I predict lower rates to go along with a collateral shortage and stronger dollar for the rest of the year.
Oil
Oil is another very misunderstood commodity. I include myself in that as well. Most CPI changes can be attributed to oil alone. Which makes sense right now, because oil has tripled from this time last year, no wonder the CPI is rising.
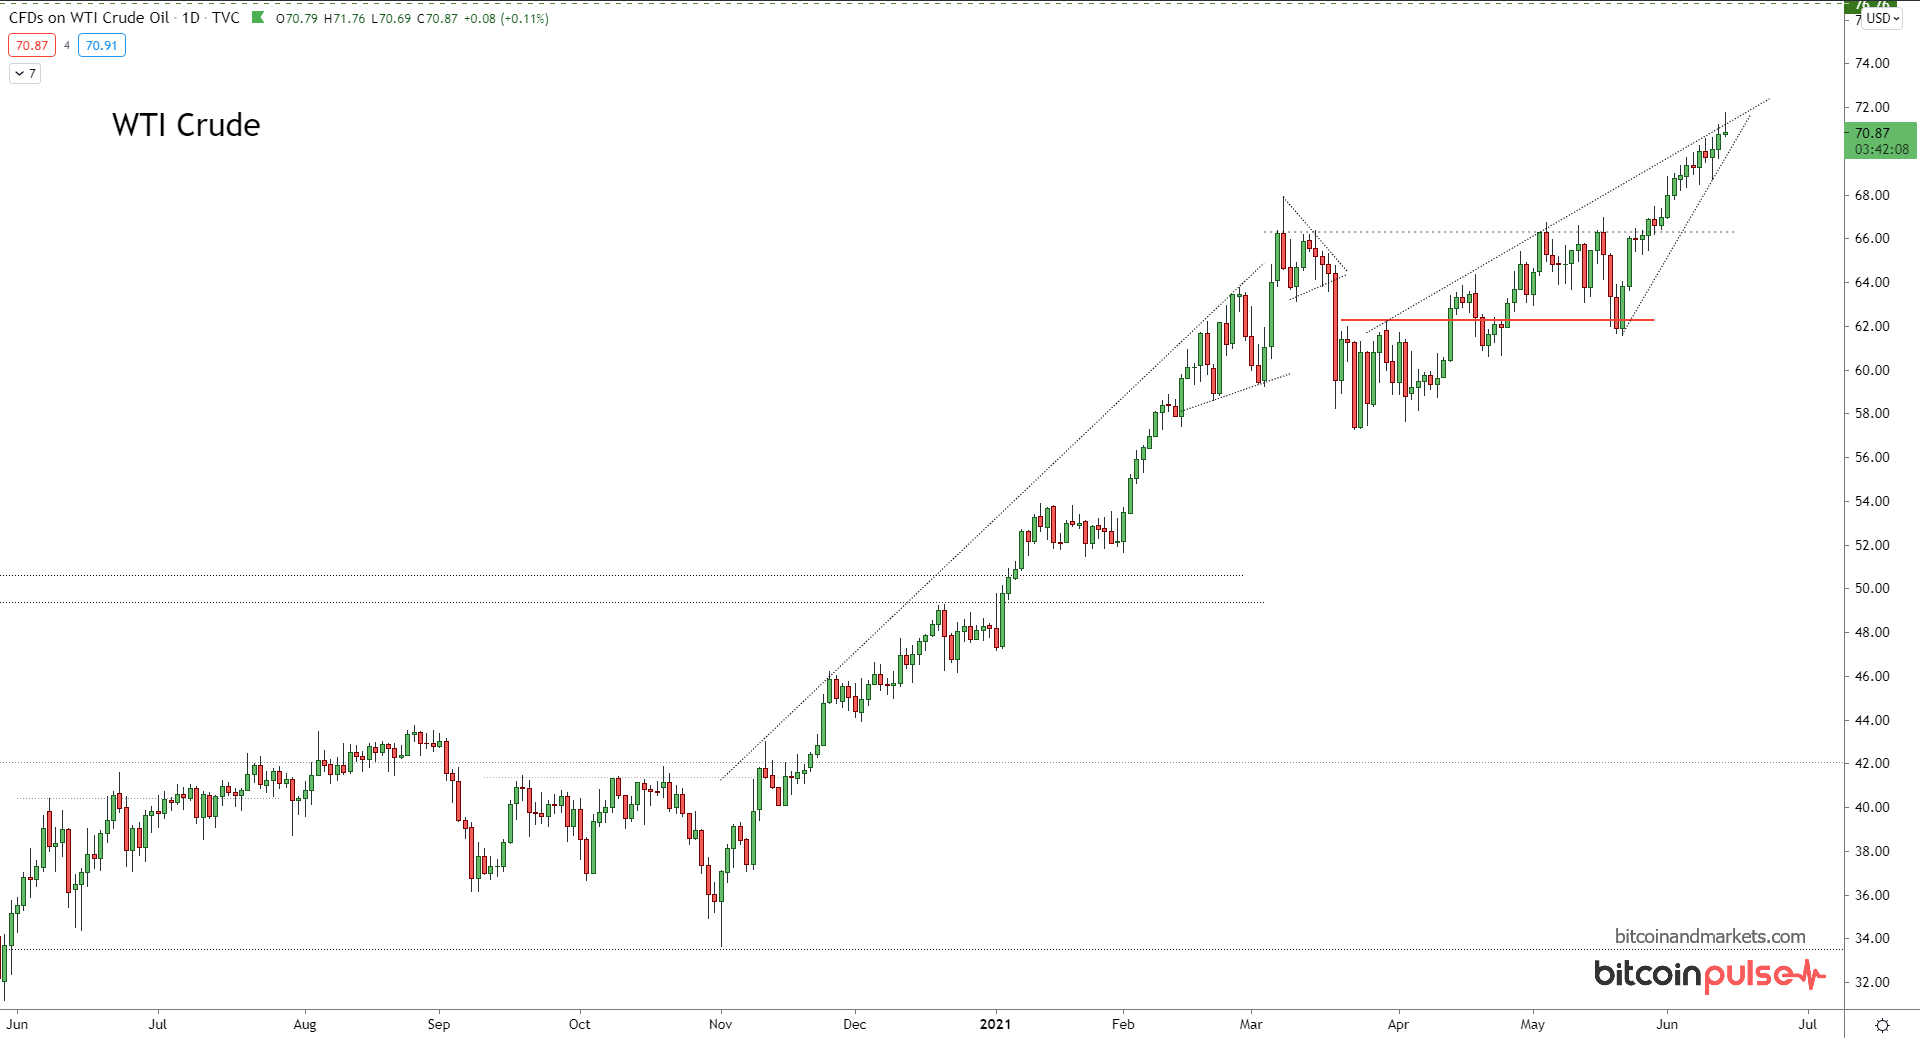
This recent move, since May 25th, is gravity defying. Inventories for crude around the world have dropped significantly in the last year, with high hopes for a dramatic recovery in global demand.
However, from a technical analysis perspective, this rally looks to be running out of momentum. Like in many markets, there might be a fake out above the rising wedge, followed by a correction back to $60.
Overall, the global economy will not be able to support higher prices if production stays at these levels or increases. At $70/bbl the pressure is definitely toward higher production and lower prices.
That's going to do it for this week. Please check out the Bitcoin Pulse, it my member newsletter on bitcoin and I tie in a lot of macro as well.
Enjoying these posts? Subscribe for more
Subscribe nowAlready have an account? Sign in