Let's Talk About the 3 Month/10 Year Spread

In previous posts we have focused much of our attention on the inversion of the 10 year and 2 year notes as well as said inversion's relationship with the R-word (recession). Some, however, insist that the inversion of the 3 month bill and 10 year note is the true recession signal. Regardless of preference, the inversion of each of these yield curves has presaged every recession going back more than 40 years. In today's missive we will only be focusing our attention on the 3 month/10 year spread.
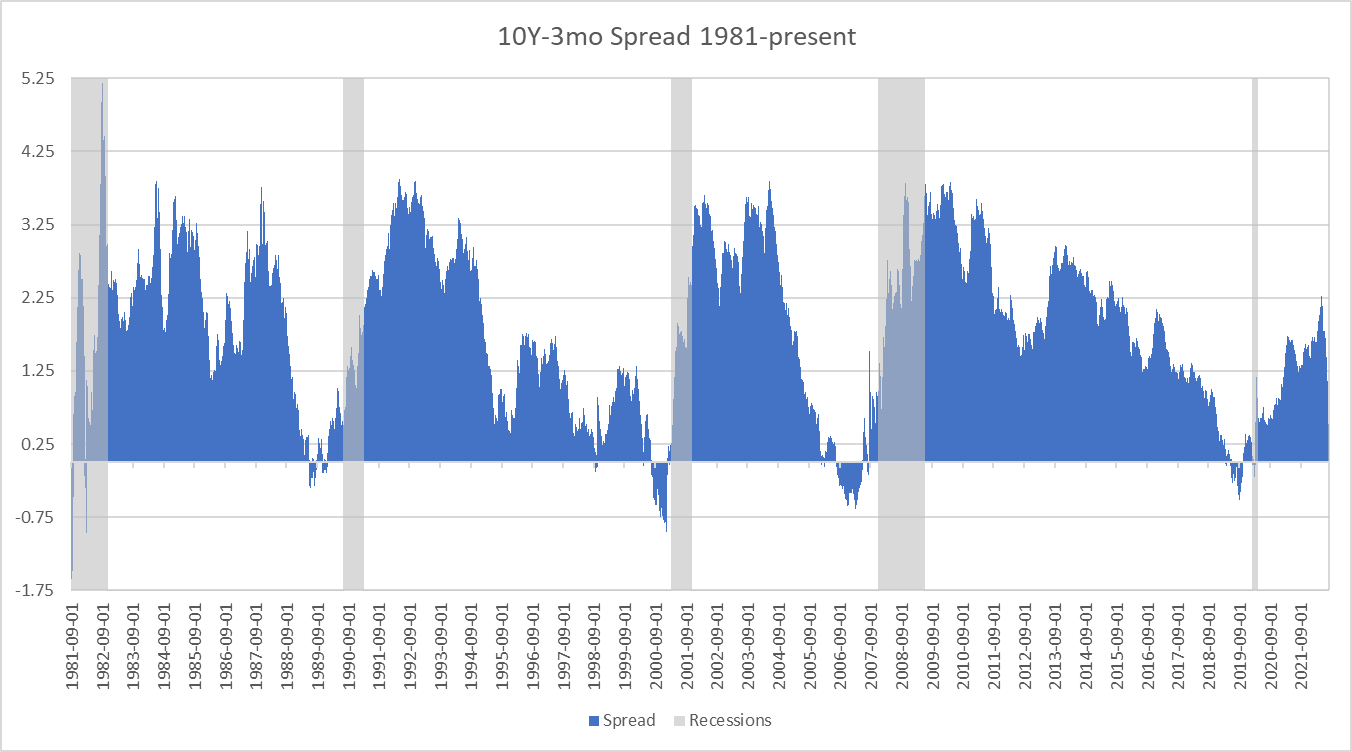
The chart above clearly shows that inversions of the 3 month/10 year have been followed by a recession each and every time i.e. one does not proceed without the other. While the inversion of the 10s and 2s has already occurred on two separate occasions in 2022 we have yet to witness the inversion of the 3 month/10 year. The spread has shortened to just under 20 bips on more than one occasion (typically during intraday trading) but has yet to go negative.
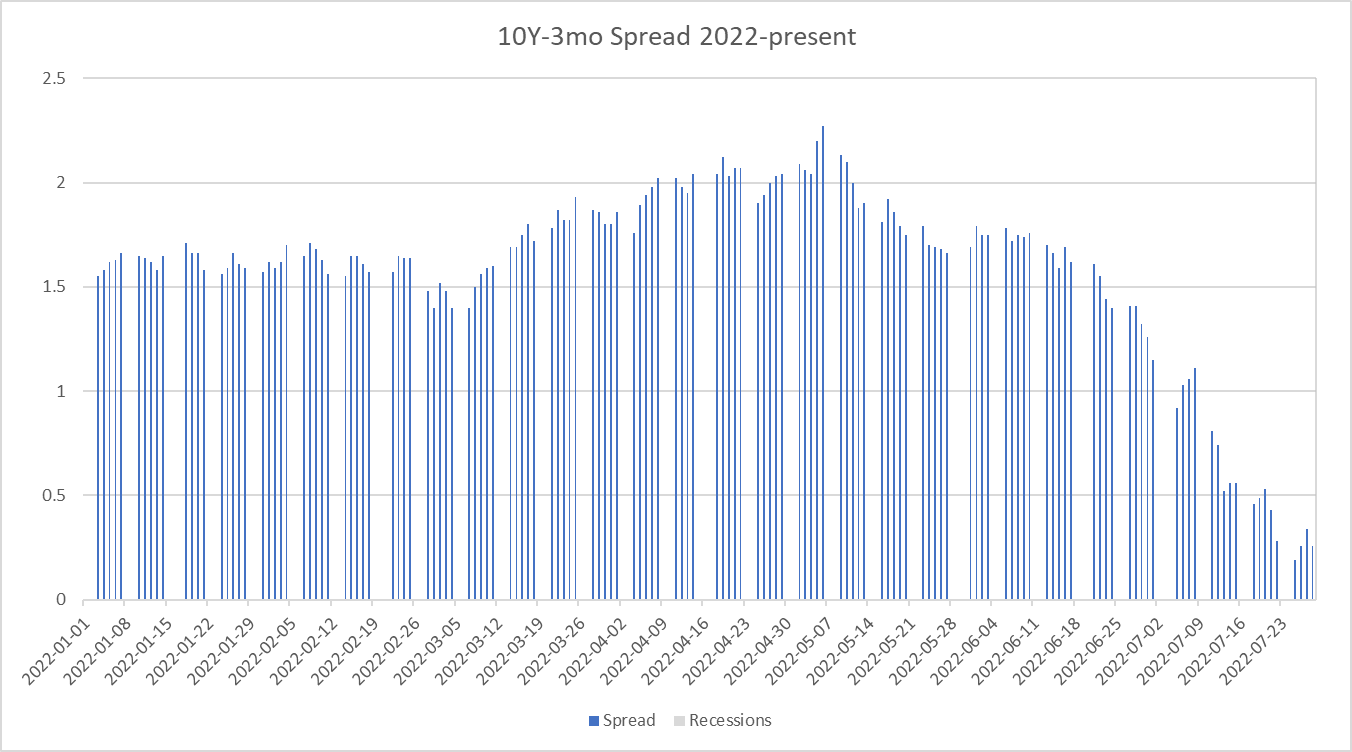
As the yield spread between the 3 month/10 year continues to compress I thought it would be helpful for the reader to understand what happens when/if this inversion occurs, namely in terms of the time it takes to go from inversion to recession and/or inversion to stock market peak. Let's start by looking at the historica lengths of time from inversions to recessions.
The number of days from the first inversion of the 3 month/10 year to the beginning of each recession below, as defined by the NBER, are as follows:
1990 - 461 days
Dot-com - 903 days
GFC - 683 days
Covid - 316 days
The number of days from the first inversion of the 3 month/10 year to the beginning of each stock market peak and subsequent crash/correction are as follows:
1990 - 461 days
Dot-com - 547 days
GFC - 630
Covid - 335
Unfortunately the data only goes back to 1981 otherwise I would have included the information for the back to back recessions of the early 1980s. Either way, there appears to be a significant amount of time, historically speaking, between the inversions of the 3 month/10 year and recessions and/or stock market crashes/corrections (1990 involved a short 16% pullback so I personally would hesitate to make much of it).
While this data provides a ripe opportunity for speculation about where we are headed and how long it will take, especially considering how crazy 2022 has been thus far (back to back negative GDP prints (technical recession), high CPI prints, inventory buildups, debt, etc) I will leave that to the reader. I do however want to point out one data point I that I personally find fascinating. The labor force participation rate was increasing into both the 1990 and Dot.com recessions...but has been decreasing ever since. The underlying fundamentals today are also much different than those from 20 and 30 years ago and should be considered whenever trying to analyze this type of information.
Enjoying these posts? Subscribe for more
Subscribe nowAlready have an account? Sign in