Chart Rundown for 3/29/2021

Recently, I've been publishing this set of charts for discord members and on twitter, but thought it would be better to post them here in a Monday morning series. The charts selected are the markets and prices I watch daily.
My personal thesis is I'm waiting for stress in the system to reappear. At this moment, it is starting to look like 2014 or 2018 where the stress was limited mainly to economies in Europe and emerging markets. The Suez debacle could have some major consequences for all those regions, while the US is generally isolated from it all, and is gearing up for growth.
Bitcoin Price
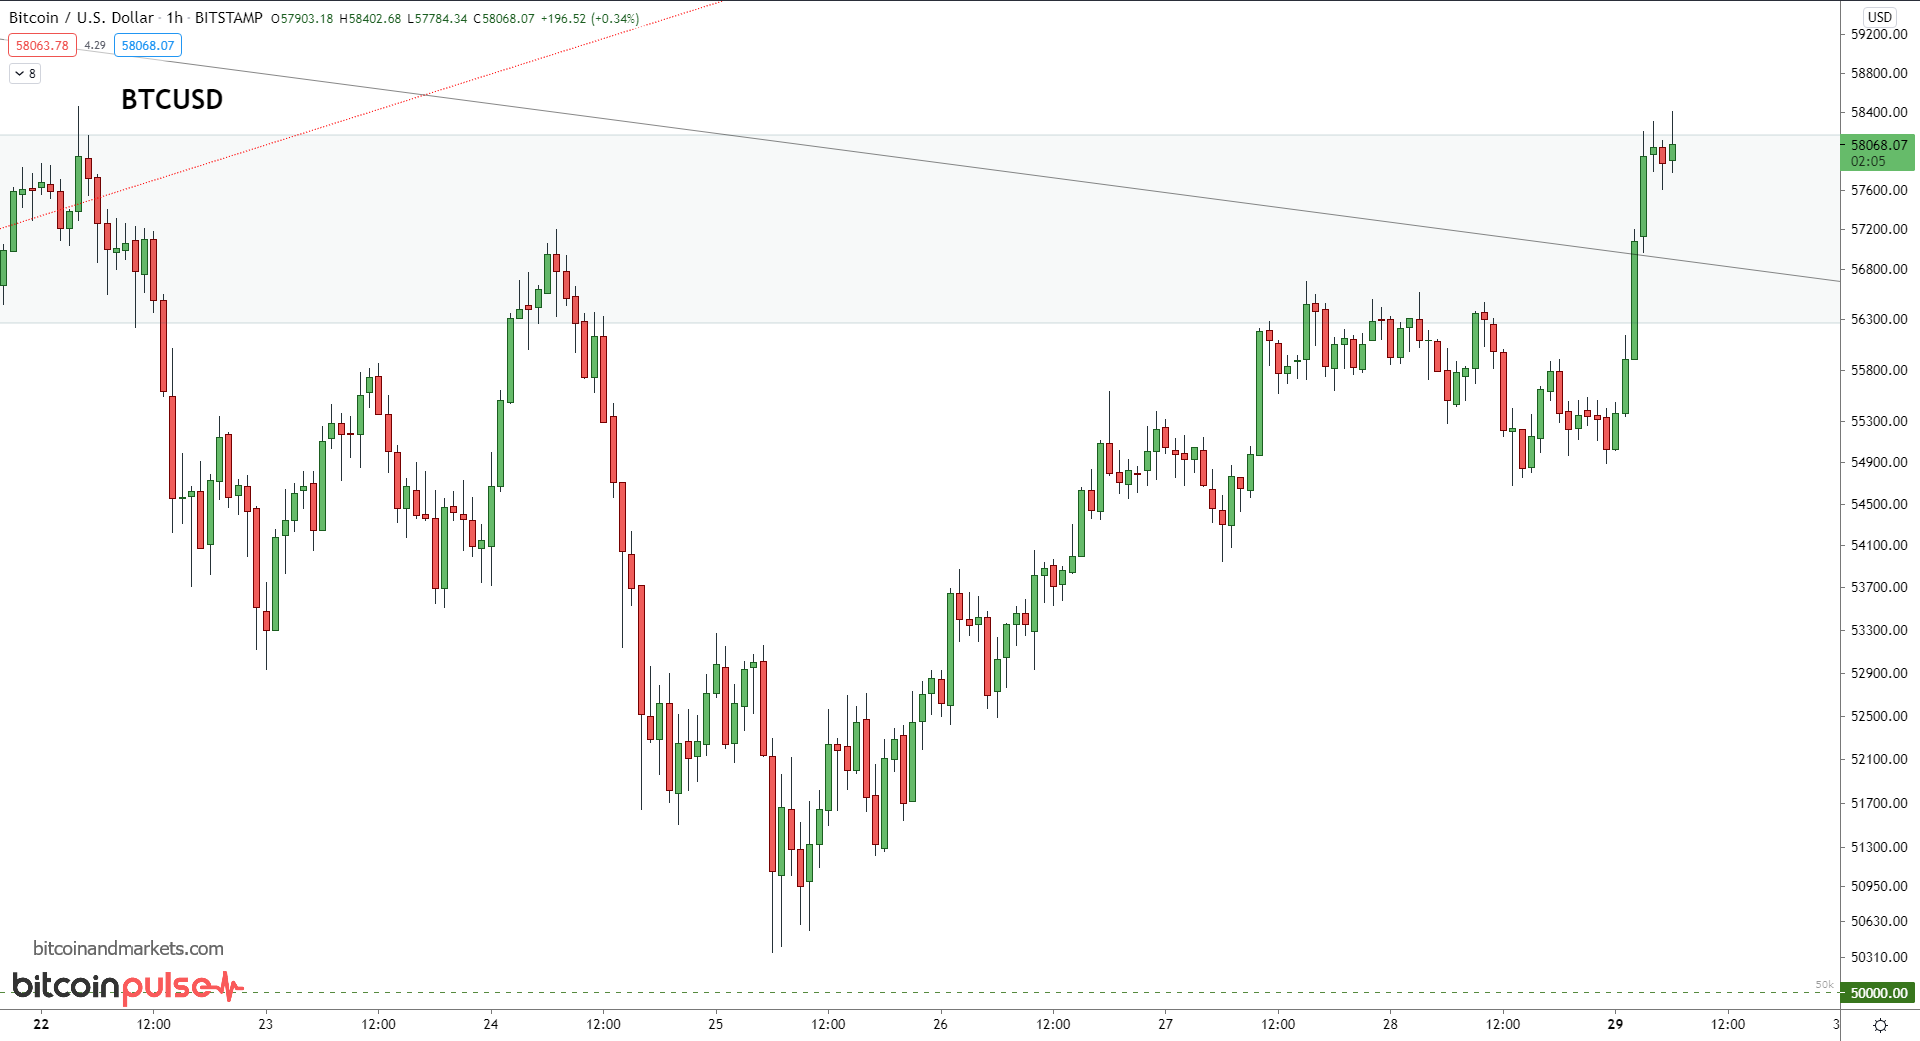
It's looking nice and strong threatening to break through the resistance area in the $56-58k range. There is a chance that support at $57,000 is tested prior to $60,000, but all signs are for higher bitcoin prices.
Ethereum Price
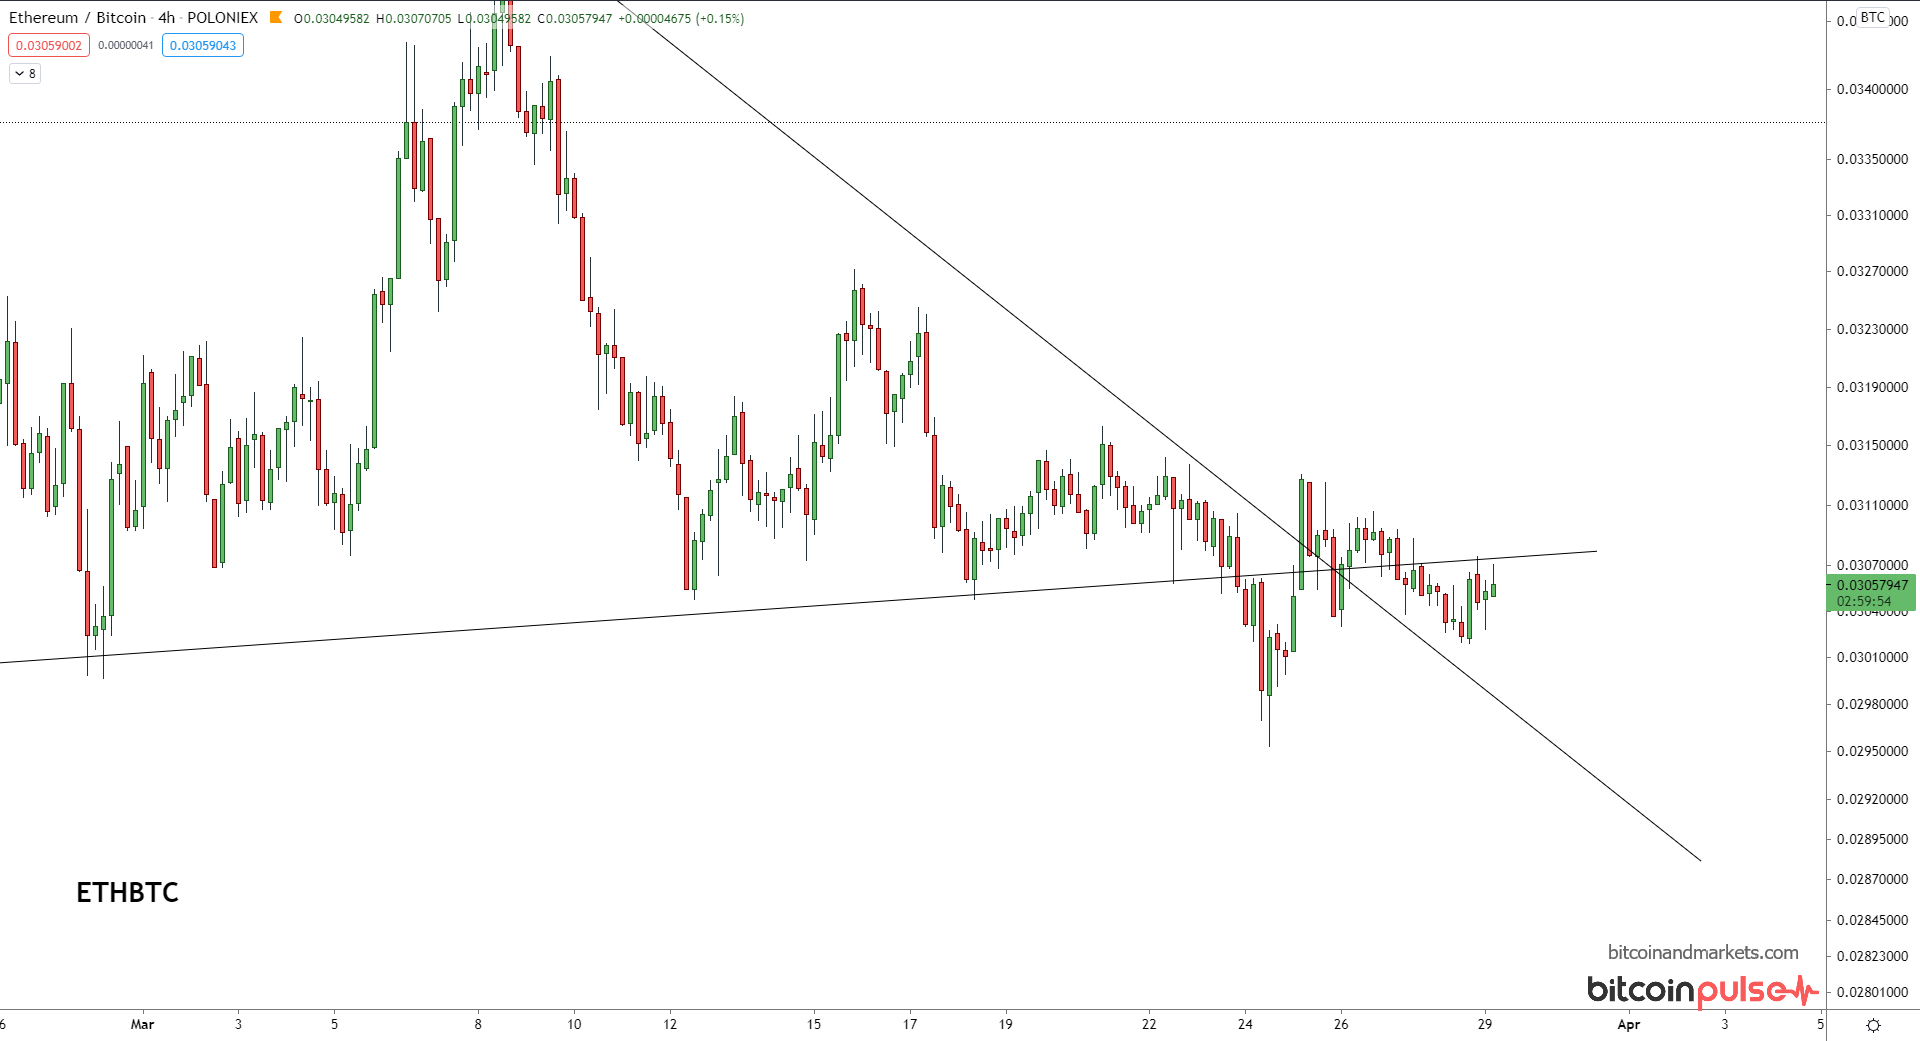
Ethereum is looking weak. Many ETH promoters are trying to lump ether in with bitcoin's 4 year cycle, but there's no reason ETH should follow bitcoin other than it is a meme that depends on bitcoin to survive.
ETH is struggling to remain above previous cycle highs, and is looking quite flaccid when charted against bitcoin like above. Previous support has turned at least to temporary resistance, so we'll have to see how this develops. Don't forget, altcoins tend to lose value against bitcoin overtime, because they are centralized meme coins trying to look like decentralized disruption like bitcoin. They will tend toward zero overtime. Ether is a special case, because it is a ponzi on which to build other ponzis. So it will take a while to die.
At least for now, ethereum is slowly bleeding versus bitcoin.
Gold price
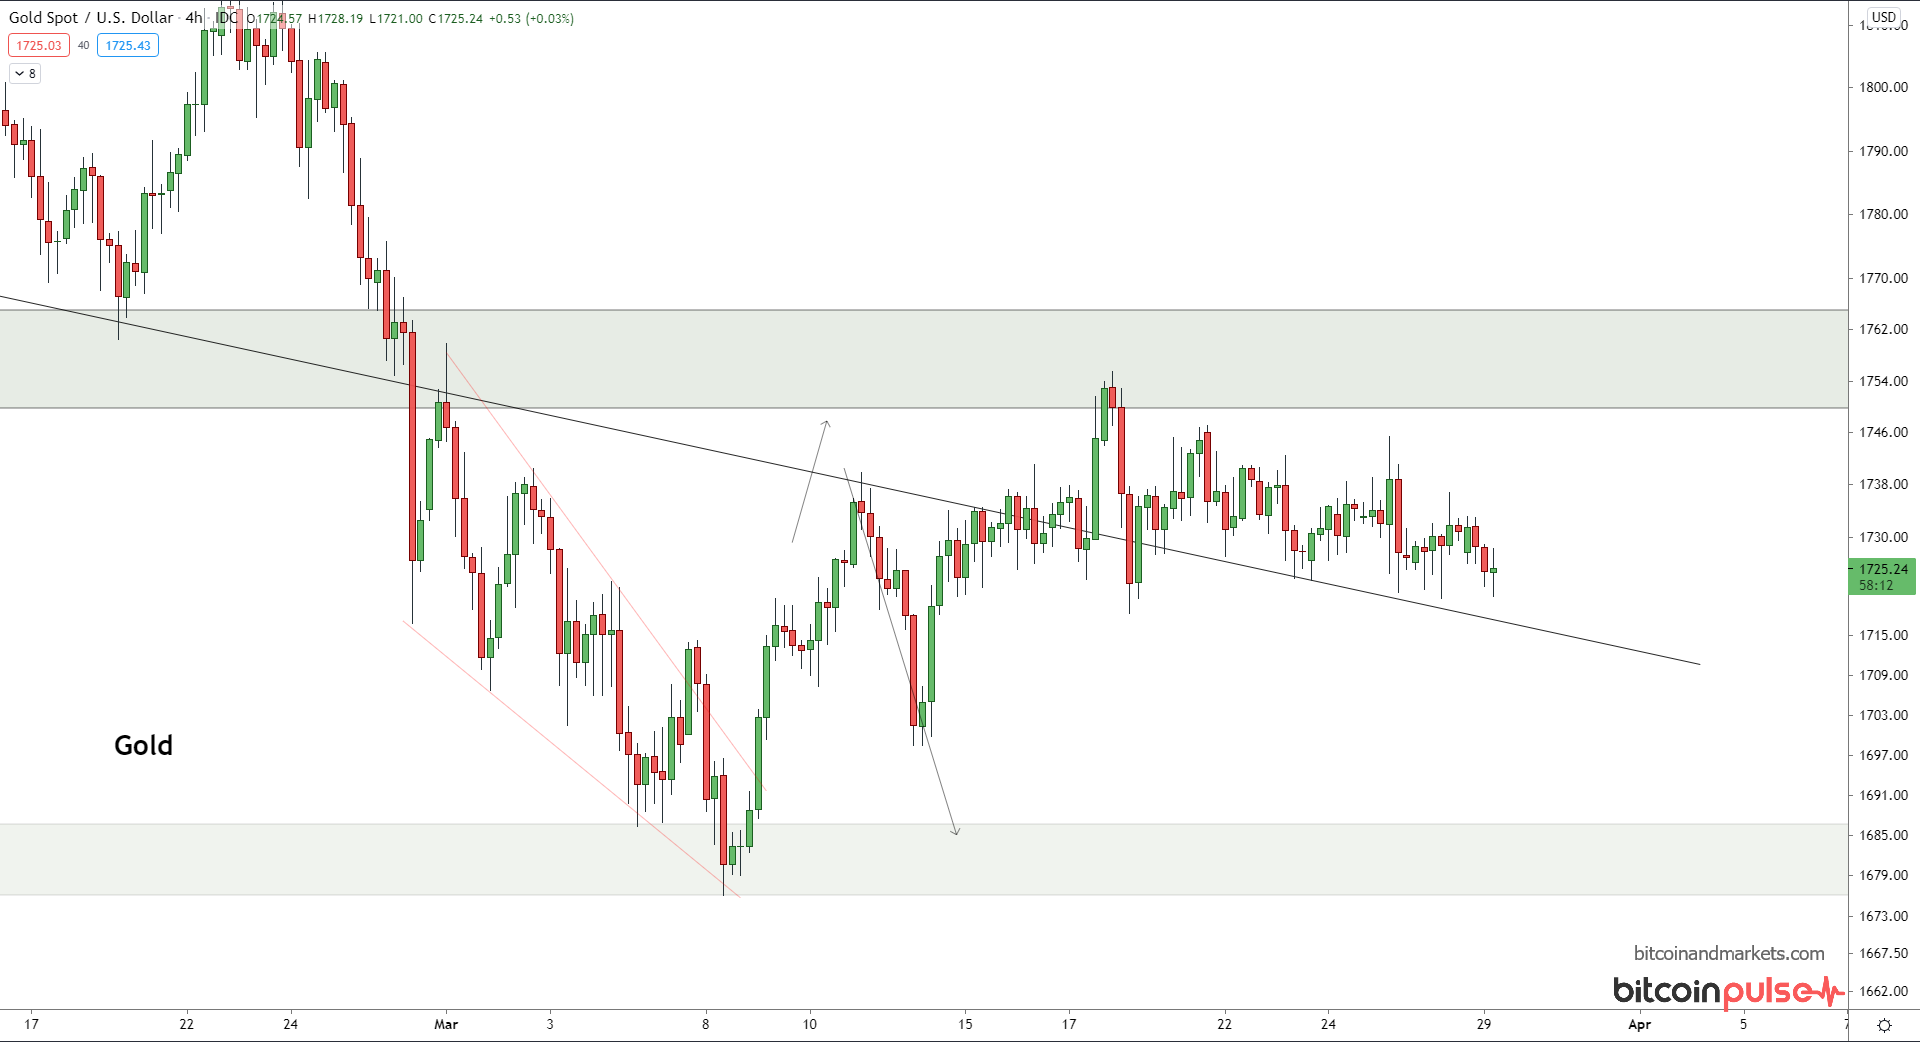
Nothing much new for gold. It has been rejected by the previous support now turned resistance at $1750. I still expect the next 3 months to be quite rough on gold, and then for it to being it's climb.
Gold's plight is not due to manipulation. Every market is manipulated. In fact, the superiority of a monetary good is all about resisting manipulation. Long term, I expect gold to go up in value for the next couple of years, perhaps hitting $2500/oz, but that's about it.
I didn't chart silver here, but the overall story is the same. I hope silver can hit $100/oz in the next year or two, but the precious metals' roll as monetary metals will be coming to an end in the next decade. One last Hoorah is all they will get.
Dollar Index (DXY)
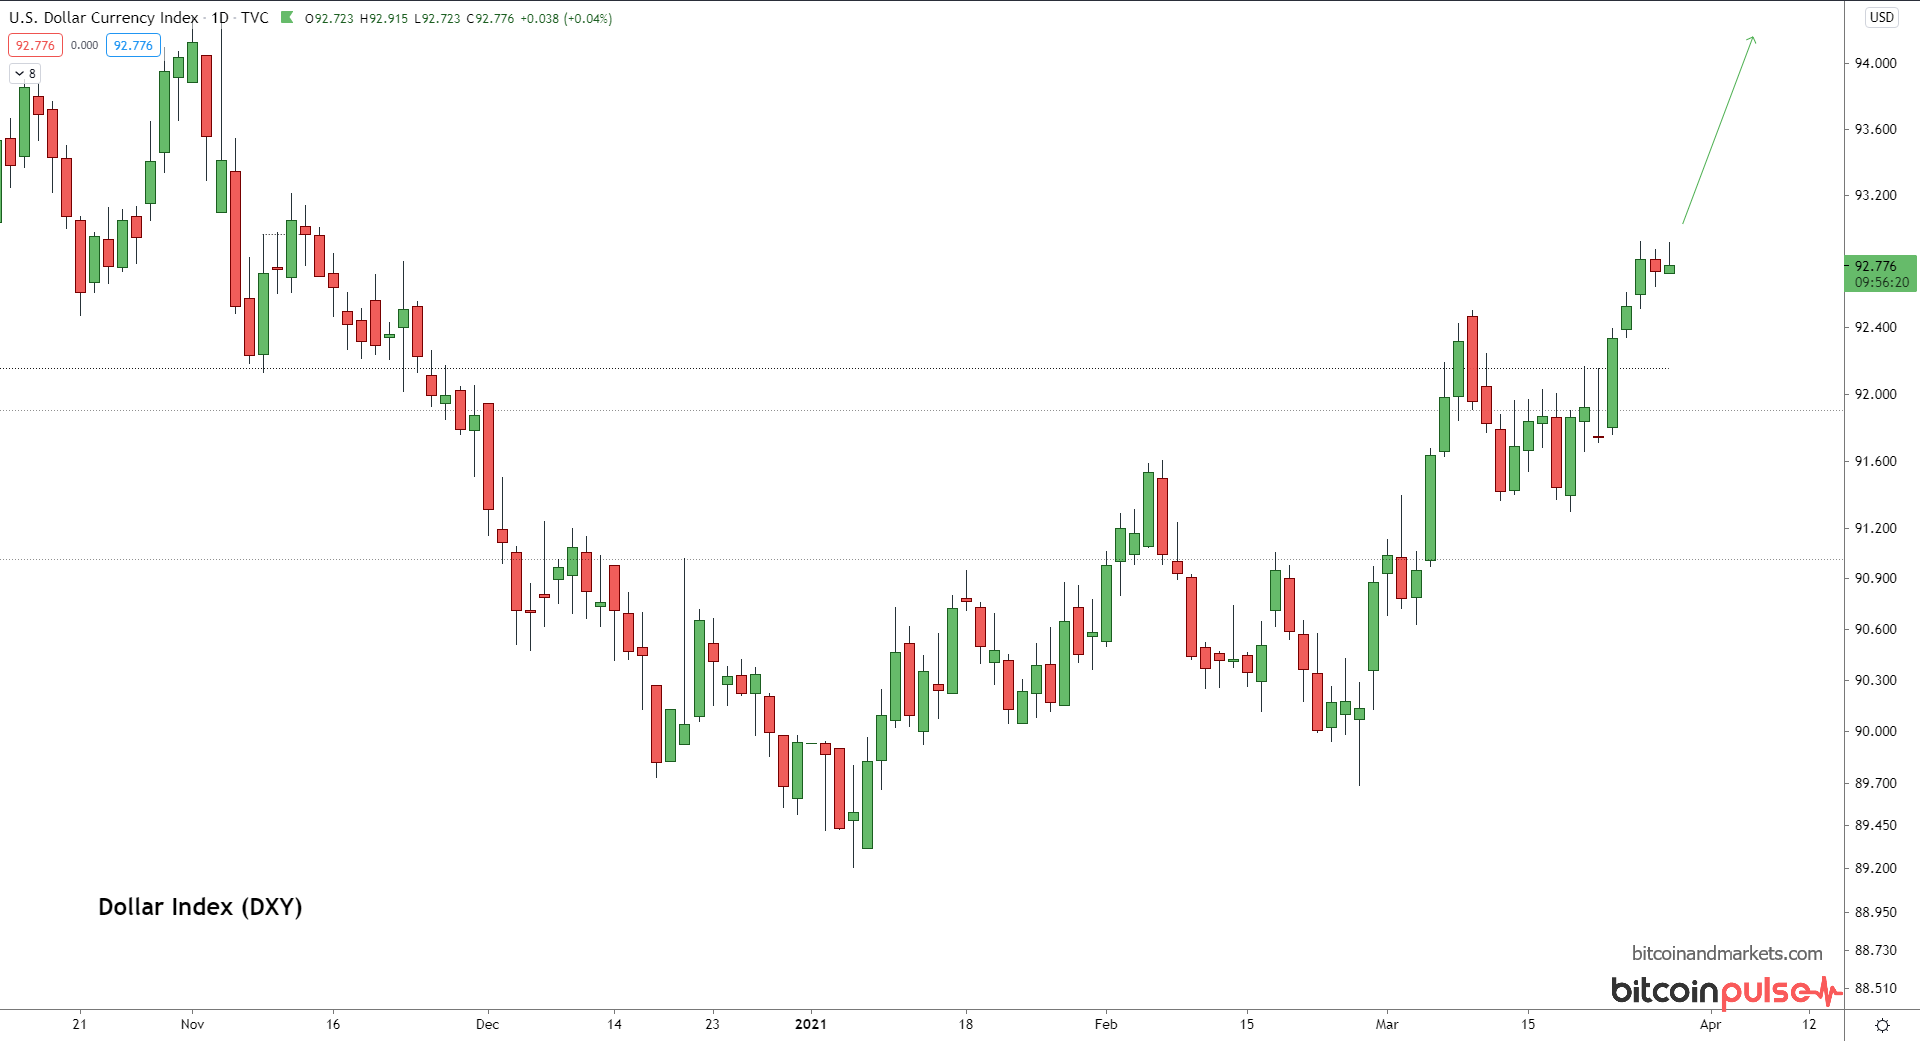
If you are a long time reader of this blog, you'll know my position here. I've been calling for a bounce after a roughly two month bottoming process, and that's exactly what we've seen. Like it or hate it, people need dollars. There will be a cycle of a weak and strong dollar until it is replaced.
The dollar can move quite quickly once it gets going. I don't see any technical or fundamental reason it shouldn't shoot to 94.5 in the next week or two. If it breaks through 95 watch out, we could have a major dollar short squeeze on our hands. That is the range to watch.
As deglobalization picks up speed in the next year, the dollar should continue to strengthen as people flee crap economies for the most liquid asset and the most liquid economy, the US. For anyone short the dollar or dollar denominated bonds, this should be very worrisome.
US 10Y Treasury Yield
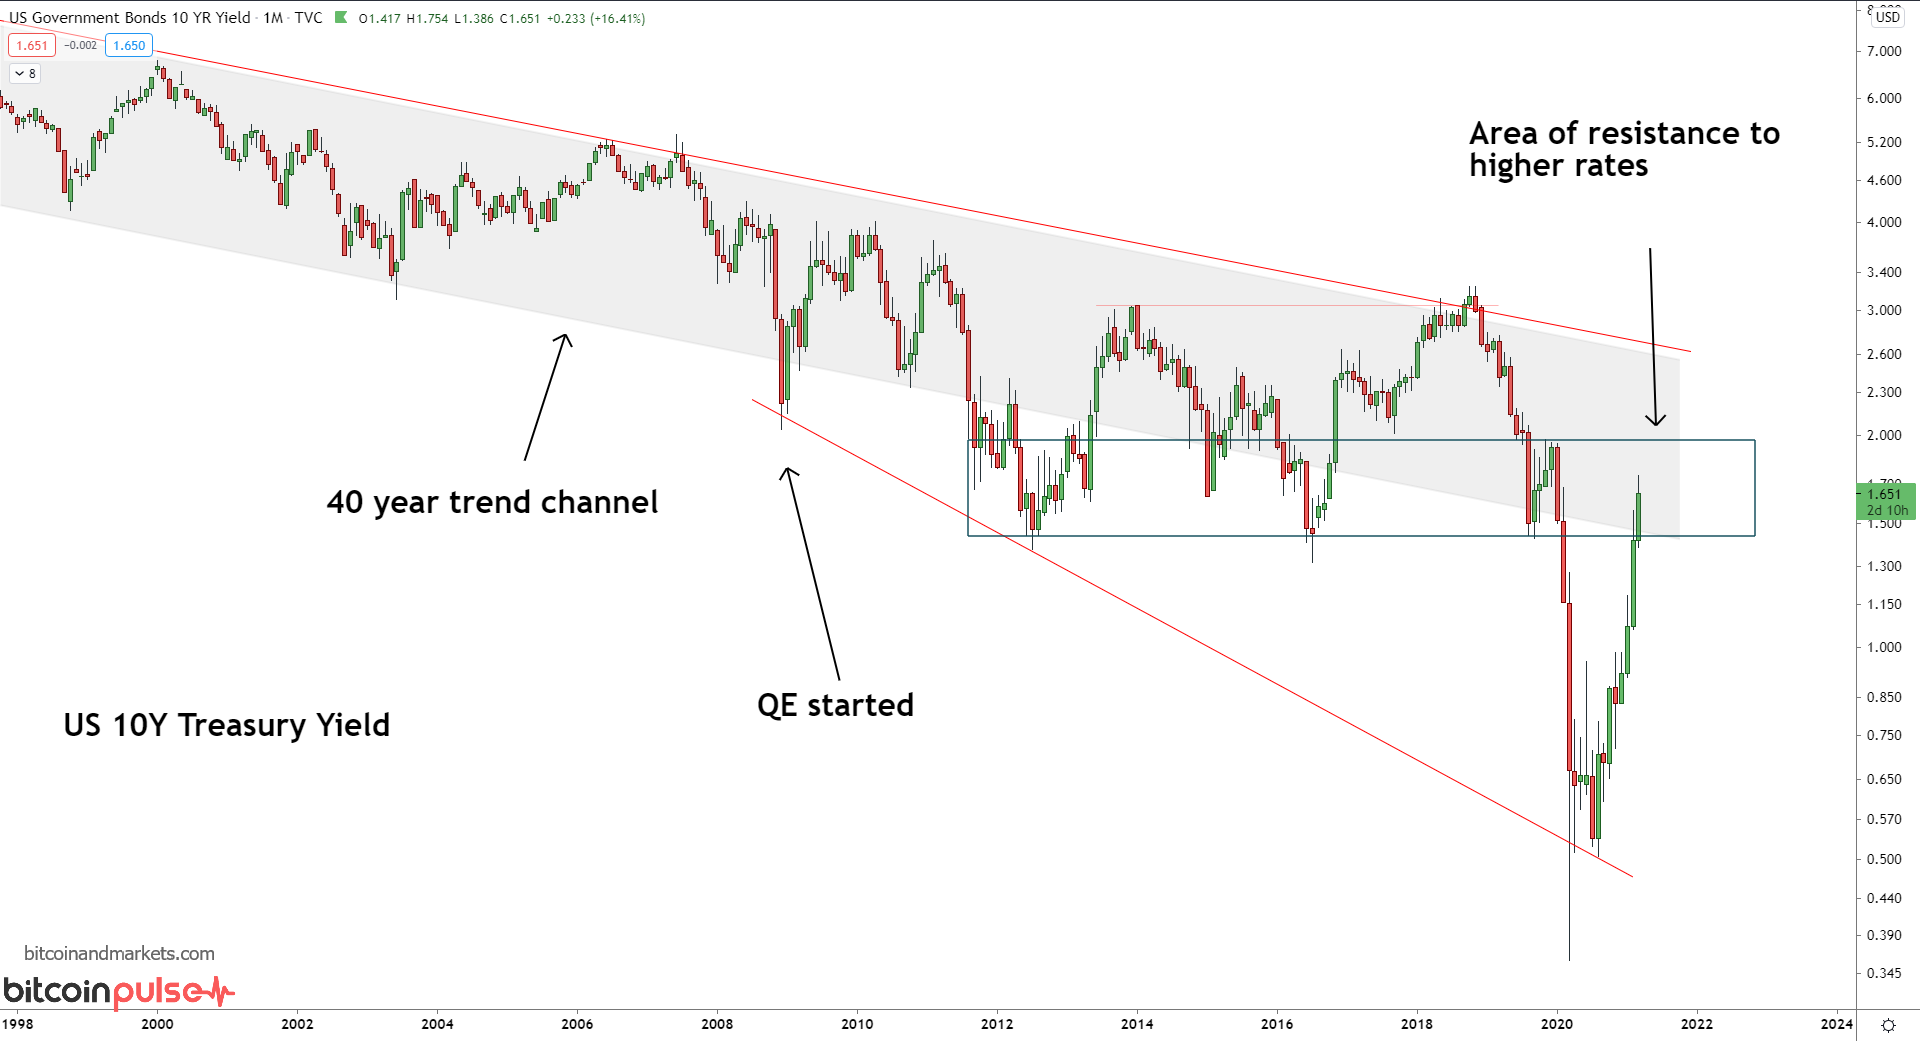
I had to include the long term chart for the US 10Y to make the picture clear. As you can see, price is back within the 4 decade trend channel of lower rates. Every since QE started, rates have been much more volatile, and fallen out of the bottom of the trend. Even this last bounce in rates, barely brings it back into the trend and other horizontal resistance zones in the box.
I expect this to reverse soon, perhaps as the dollar continues to spike. I think there is very little chance it gets above 2.6% on the 10Y.
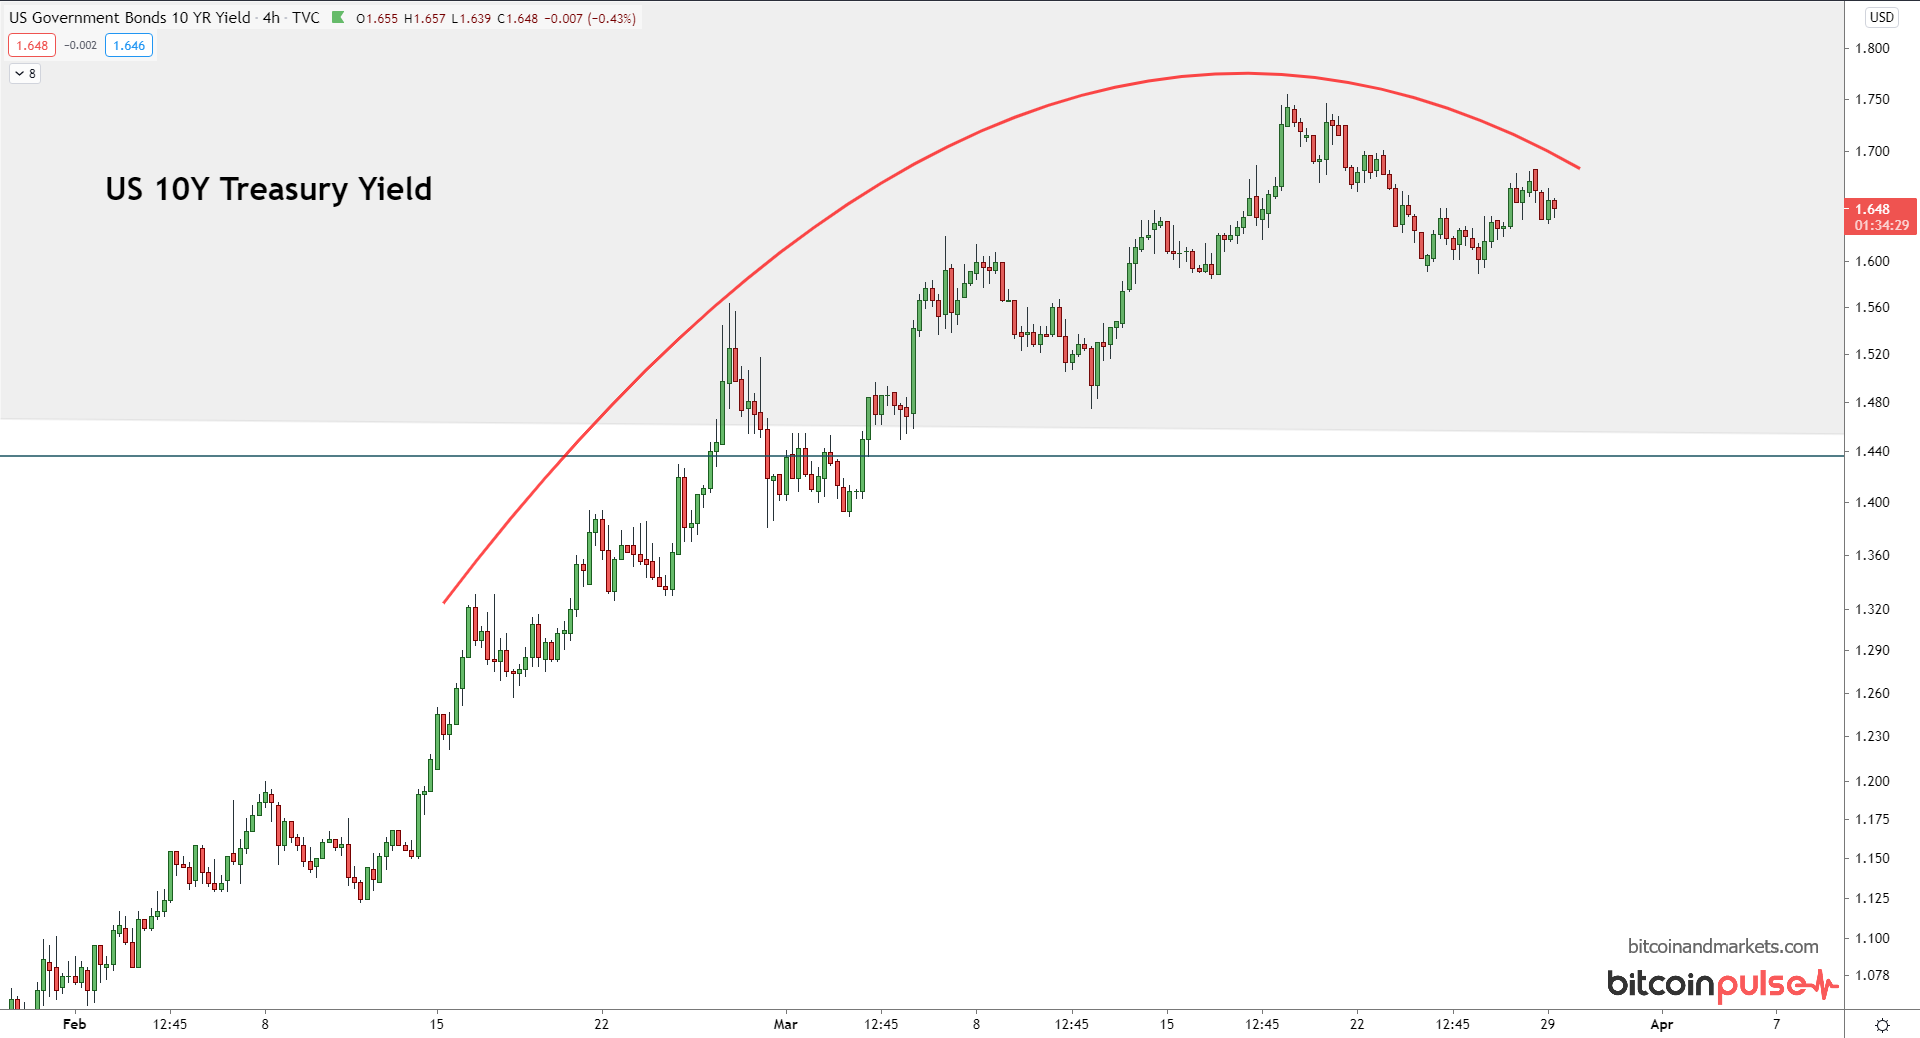
Zoomed in below, we can see somewhat of a rounded topping pattern.
Oil price
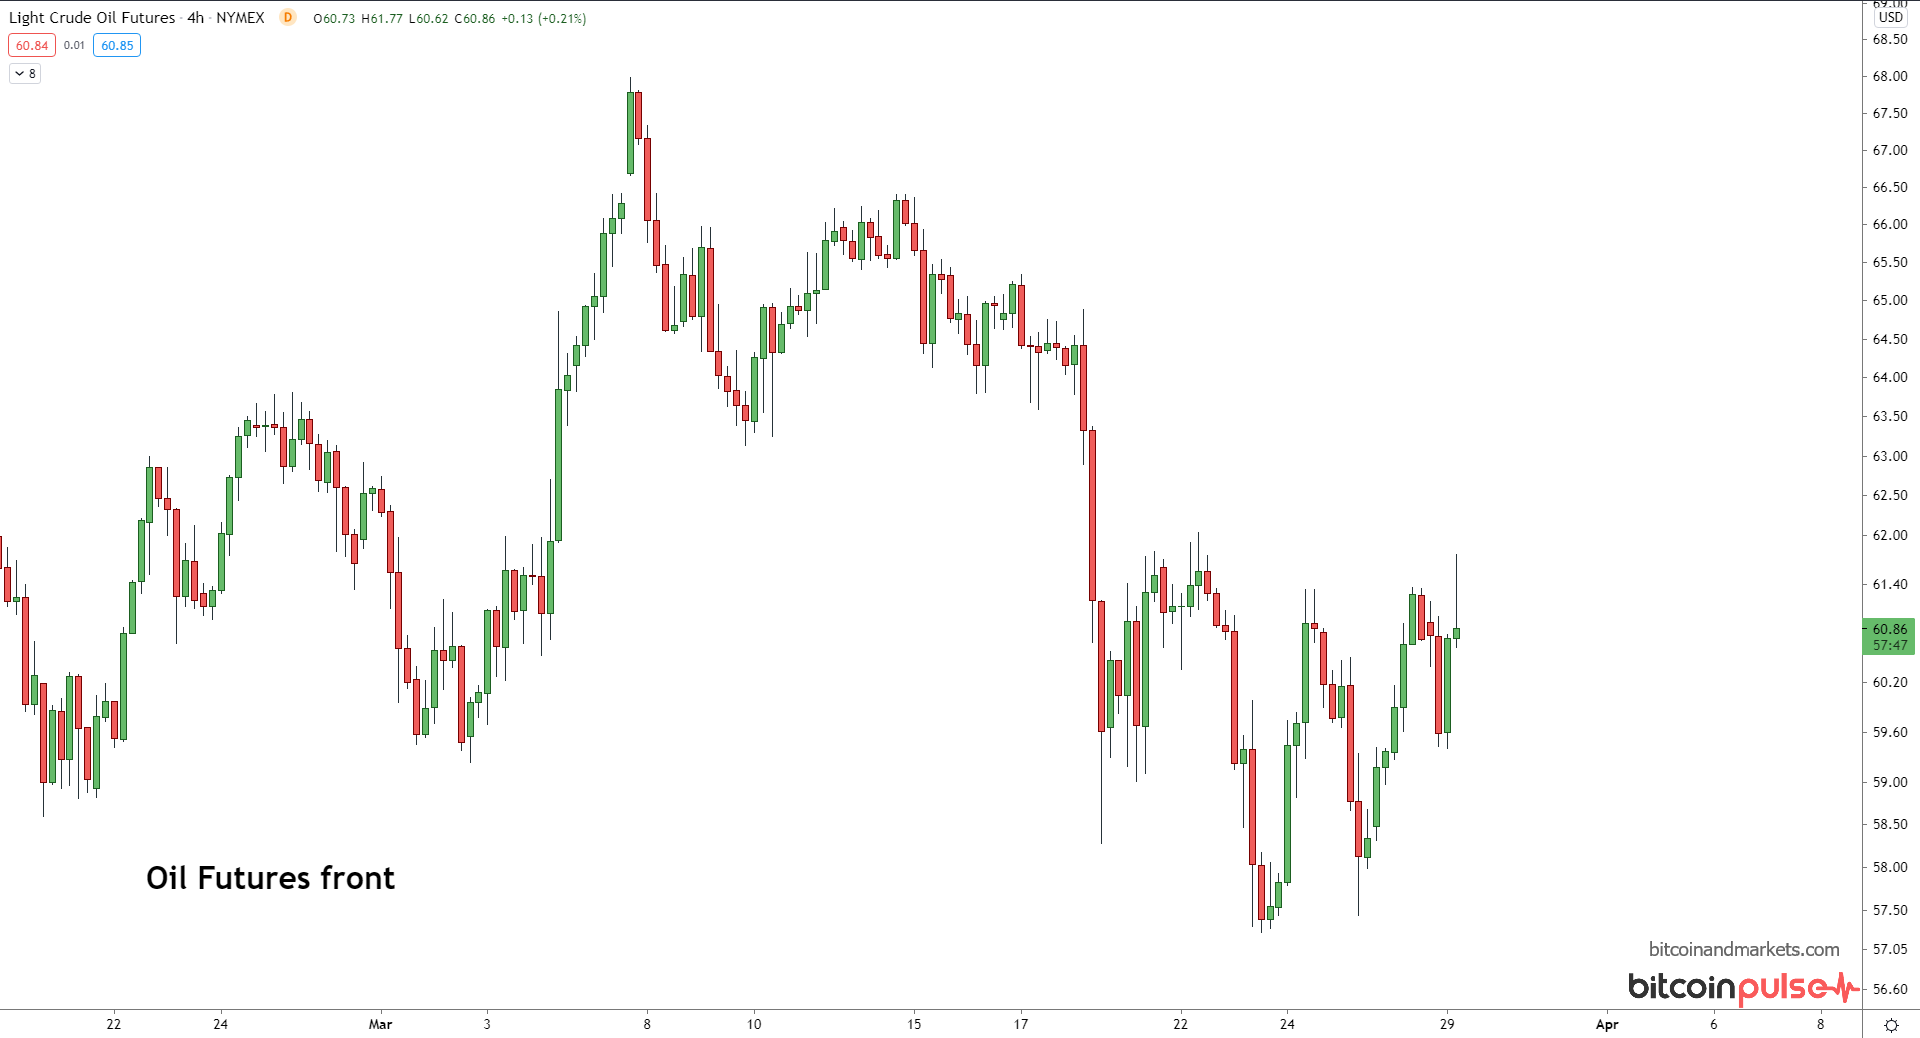
I've written previously about the ability for shale oil to come back online, and that the oil price wouldn't be able to maintain above $60/bbl for very long. That seems to be coming true. Current price of oil is barely holding the 60 handle.
Now we add in the Suez debacle, and oil hasn't spiked? 10-20% of global oil goes through that canal from the Middle East to Europe, how can the price not jump? Well, it's because demand is falling by that amount.
This is a godsend for oil producing countries actually, because just as the industry was getting back on its feet and supply coming back on line, prices were set to decrease as I predicted. I was looking for prices back in the low $40s. With the Suez blockage, prices could now maintain in the $50-60 range for the next 6 months or so.
S&P 500 stonks
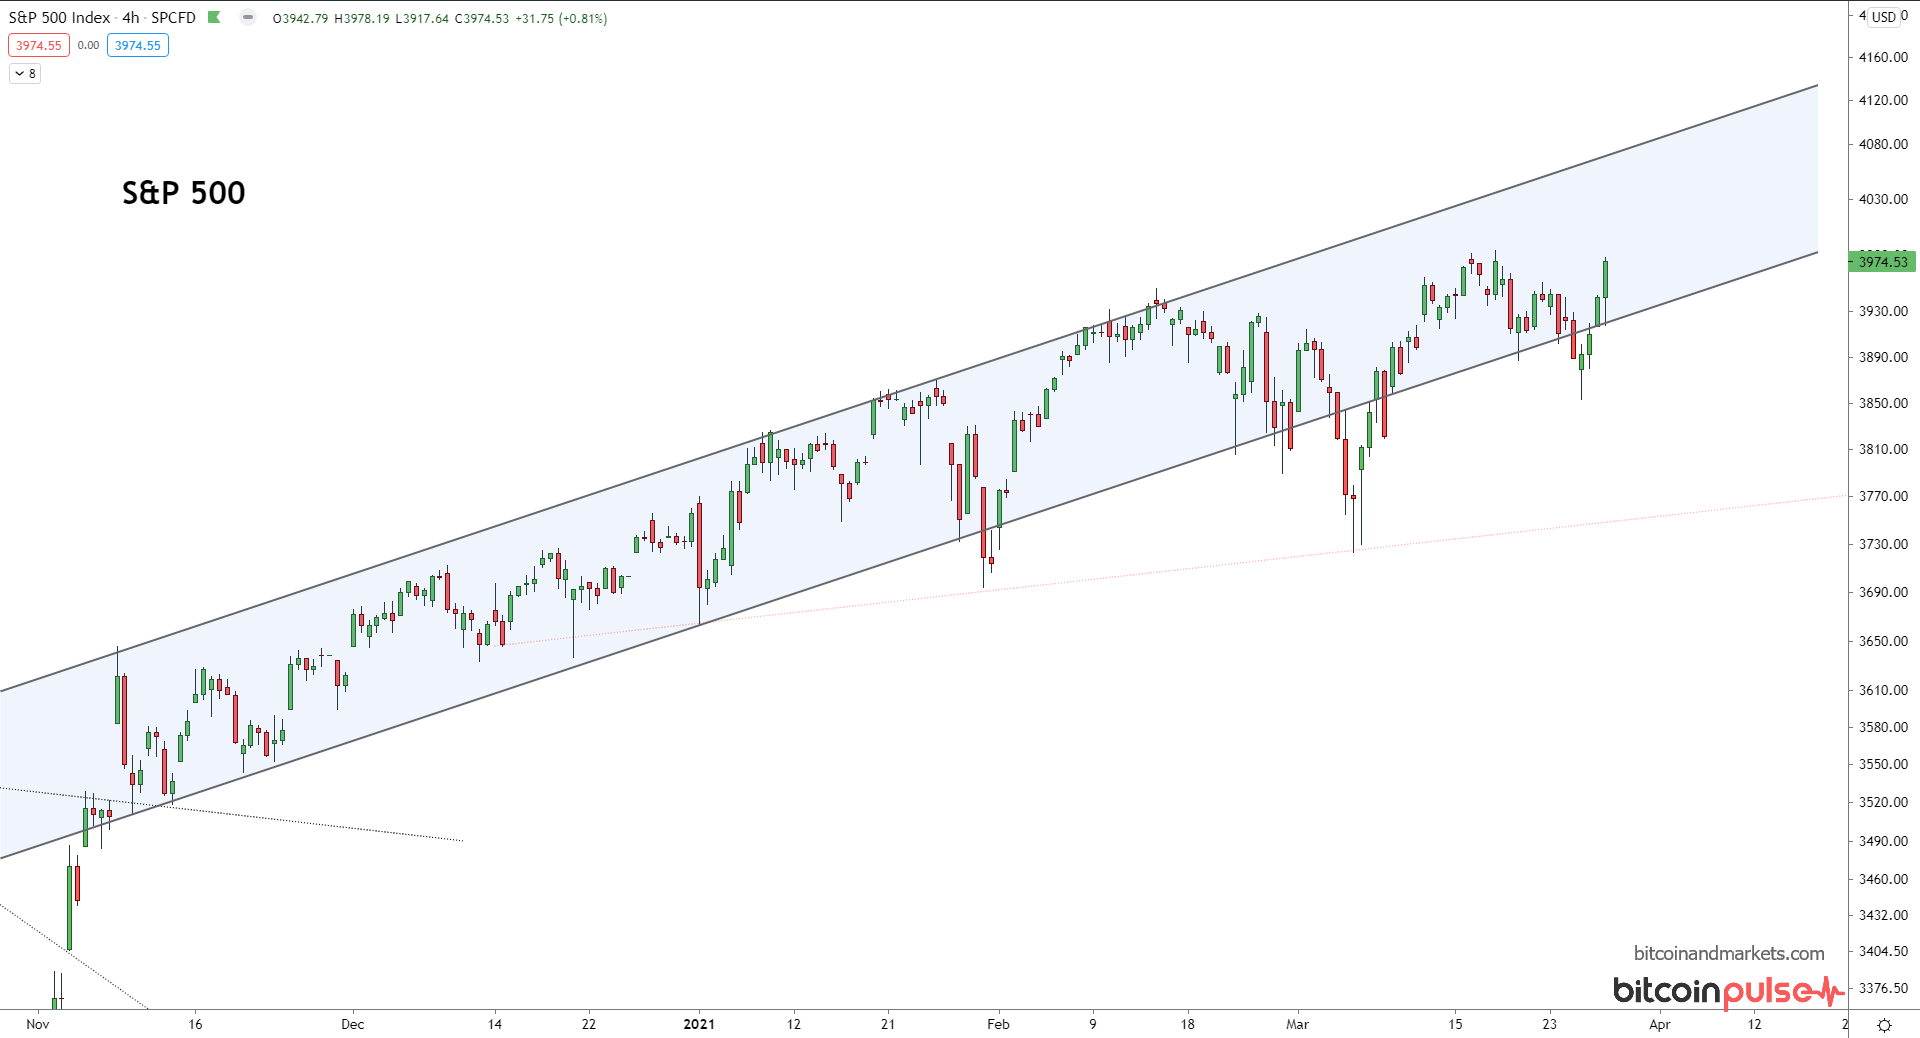
Everyone says, "the market can stay irrational longer than you can stay solvent." But another way to say that is simply that you're wrong.
The US stock market is at massively overbought territory, but it can get much worse. As the dollar crisis hits the rest of the world, capital is going to flow into the US at unprecedented levels, pumping all sorts of assets like stonks for years to come.
I expect stocks to continue to climb from here. Only outperformed by bitcoin.
Cheers,
A
Enjoying these posts? Subscribe for more
Subscribe nowAlready have an account? Sign in