Anatomy of a U.S. Debt Auction
One often hears the gripe "but who will buy treasuries?" everytime the U.S. government increases the size of it's debt. Common wisdom teaches us that without the Fed the U.S. government would quickly go insolvent. While I personally tend to think the debt will never be repaid (it is somewhere in the neighborhood of $31 trillion last I checked) this doesn't mean that there are no non-Fed buyers for said debt. International trade is conducted in dollars which means that when India purchases automobiles from Japan they pay for it in dollars and, as a result, need to constantly source dollars from elsewhere which typically means buying treasuries...and lots of them. The objective of this piece is to illustrate to the reader that not only is there enough demand at any given treasury auction to defray the cost of U.S. government largesse but in truth an excess of demand.
Treasury notes and bonds make up the largest line item in the Fed's SOMA portfolio (more on that below) so I thought it best to take from among those issues and chose to analyze the last decade of treasury auction data for the 30 year government bond. Perhaps in hindsight the 10 year note would have been a better choice for this analysis but the 30 year is still one of the larger issues. Data for all auctions can be found here.
In order to perform this analysis I will provide the reader with the definitions for each type of treasury auction participant. Charts corresponding to each market participant will then be provided to illustrate the difference in volume between the amounts tendered versus what was ultimately accepted (hint: the former is much larger than the latter). Lastly, we will observe the specific auction characteristics of each auction participant such as volume and participant share. The information indicated above will be followed by some key takeaways as well as a summary. Let's get started.
Non-competitive Tender
What is a non-competitive tender? The definition per Investopedia is as follows:
"A non-competitive tender is an offer to buy United States Treasury securities that is made by non-institutional investors (for example individuals, organizations, etc). These smaller investors do not participate in a formal auction for the securities but instead accept the market price set by other participants."
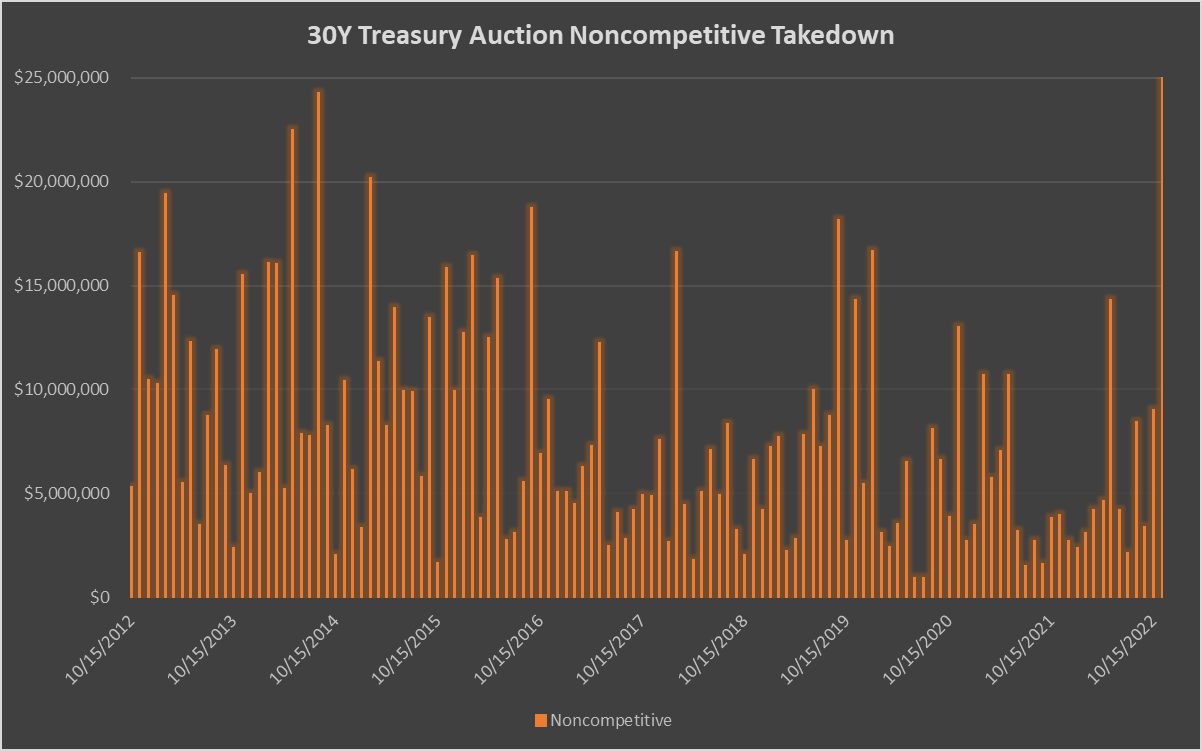
During November's treasury auction noncompetitive bidders took down 0.12% of the total amount issued for a total of $35,259,700; over the last decade the noncompetitive bidders have taken down 0.04% of the total amount issued for a total of $959,572,500.
The non-competitive bidder has the least amount of influence in a treasury auction.
SOMA
What is the System Open Market Account (SOMA)? The definition per Investopedia is as follows:
"The System Open Market Account (SOMA) is managed by the Federal Reserve Bank and contains assets acquired through operations in the open market."
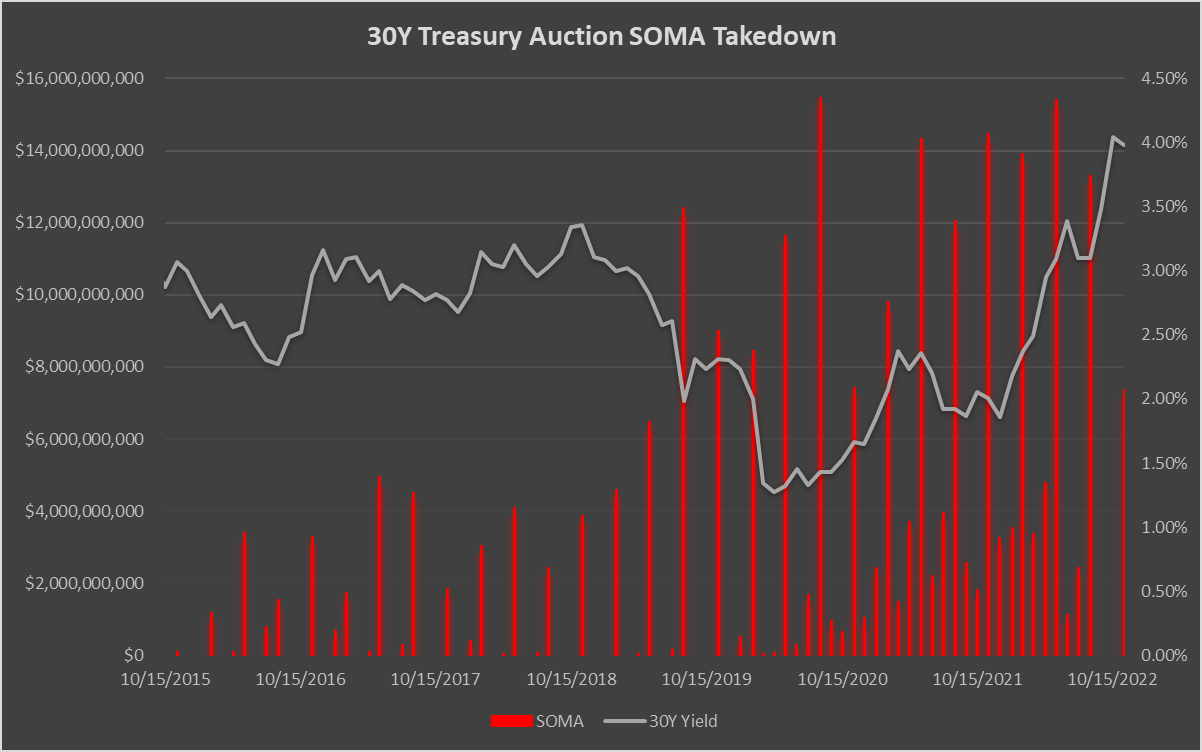
During November's treasury auction the SOMA portfolio took down 25.96% of the total amount issued for a total of $7,364,202,400; over the last decade the SOMA portfolio has taken down 11.30% of the total amount issued for a total of $256,800,239,900.
The reader may have noticed that I included the yield (in grey) on the 30 year treasury in this particular chart. I thought it worth noting that yields bottomed in April of 2020 despite the largest purchases by the Fed having yet to occur. The Fed made its largest bond purchases in aggregate between August of 2020 and August of 2022 but the yield continued to climb despite this intervention, reaching it's highest level in 11 years.
Primary Dealers
What is a primary dealer? The definition per Investopedia is as follows:
"A primary dealer is a bank or other financial institution that has been approved to trade securities with a national government. In many countries, primary dealers are the only entities who can make a bid for newly-issued government securities."
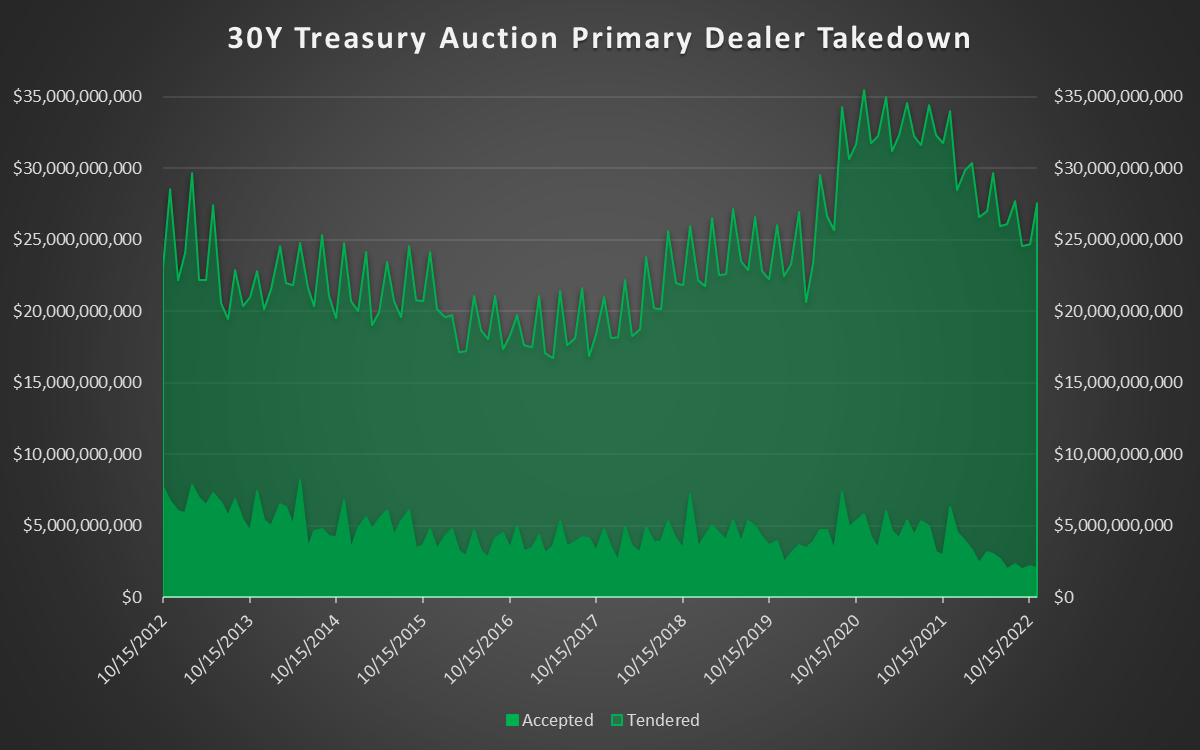
During November's treasury auction primary dealers took down 7.16% of the amount issued for a total of $2,030,932,000; over the last decade primary dealers have taken down 24.22% of the total amount issued for a total of $550,210,383,600.
Directs
What is a direct bidder? The definition per Investopedia is as follows:
"A direct bidder is an entity or individual that purchases Treasury securities at auction for a house account rather than on behalf of another party. When an individual or entity buys for their own account as opposed to buying for someone else, that individual or entity is a direct bidder."
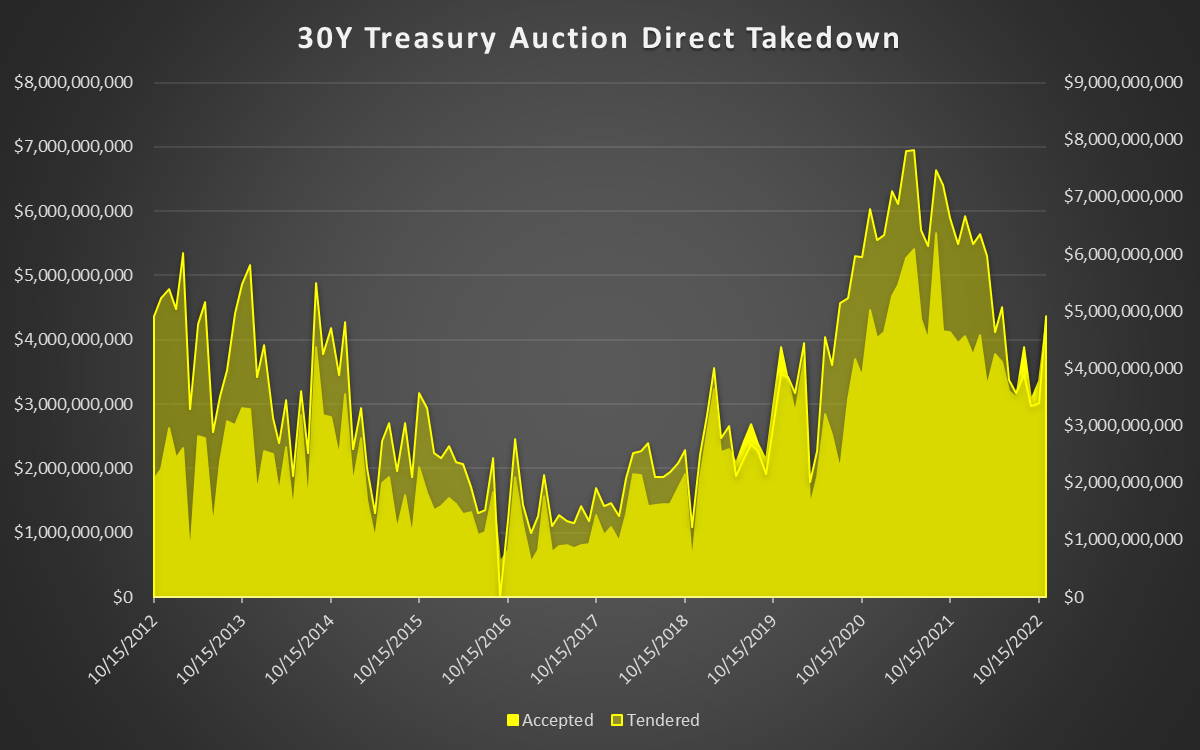
During November's treasury auction direct bidders took down 15.07% of the amount issued for a total of $4,273,800,000; over the last decade direct bidders have taken down 12.60% of the total amount issued for a total of $286,169,978,300.
Indirects
What is an indirect bidder? The definition per Investopedia is as follows:
"An indirect bidder, commonly a foreign entity, purchases Treasury securities at auction through an intermediary, such as a primary dealer or broker."
During November's treasury auction indirect bidders took down 51.68% of the amount issued for a total of $14,660,059,200; over the last decade indirect bidders have taken down 51.84% of the total amount issued for a total of $1,177,603,772,100.
Total
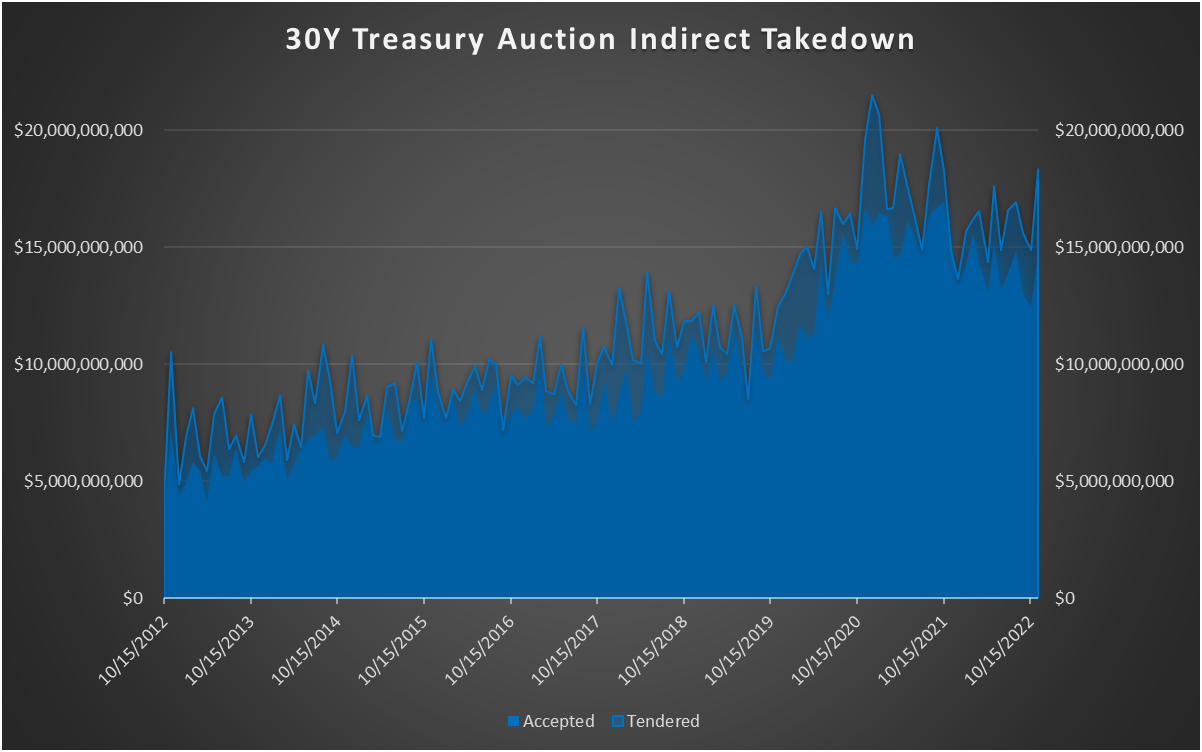
The last ten years of auction data is provided below. The first chart illustrates the total takedown by volume while the second chart illustrates the total takedown by participant share. The yield on the 30 year bond is provided as well.
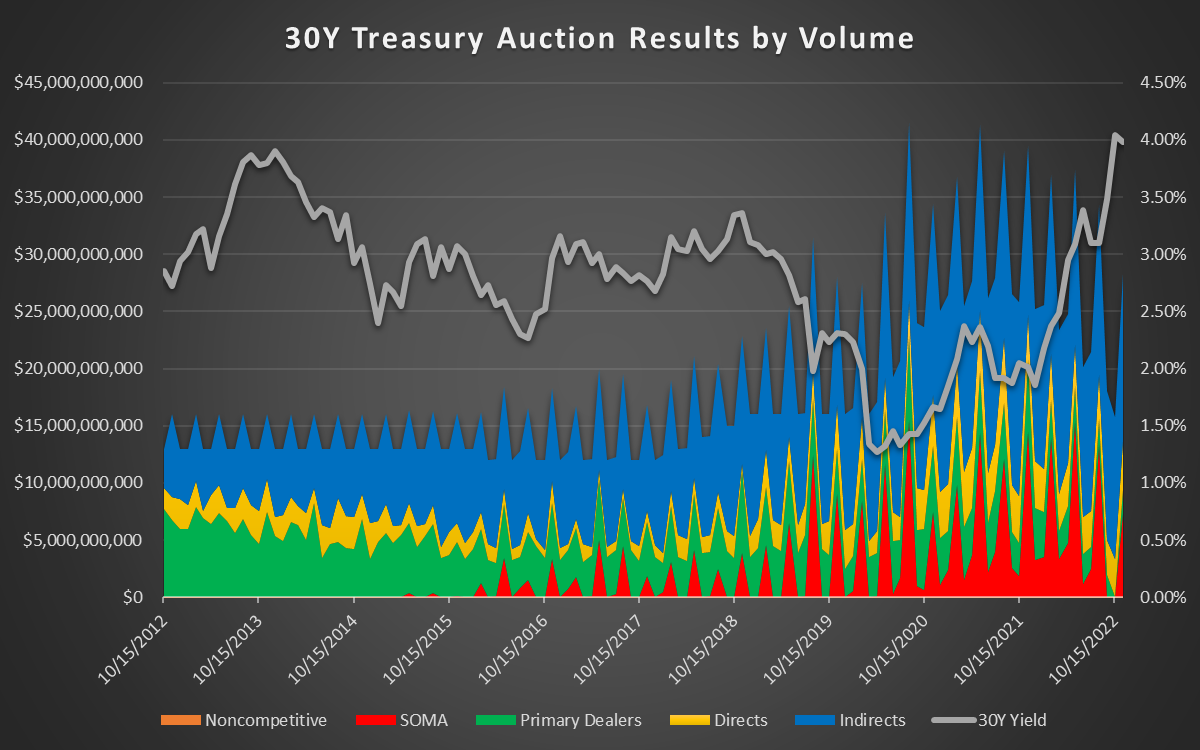
During November's treasury auction the total amount of debt issued was $28,364,253,300; over the last decade the total amount of debt issued was $2,271,743,946,400.
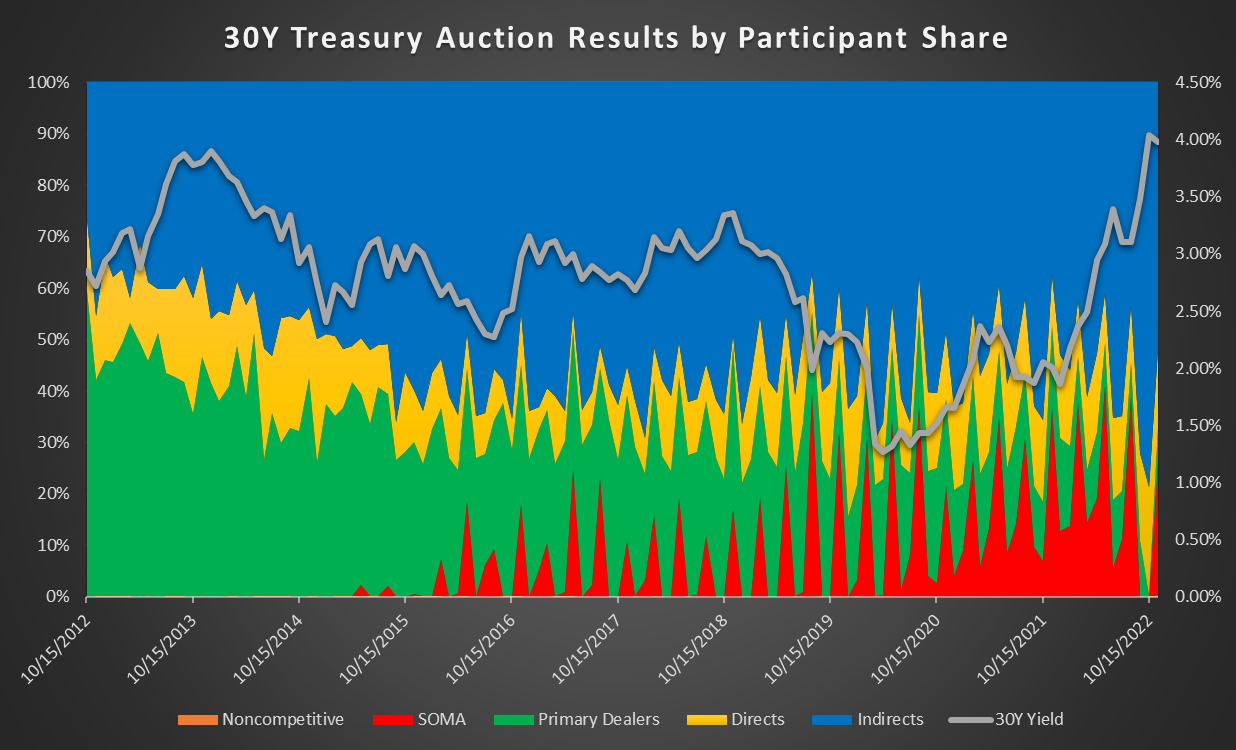
A decade ago primary dealers were the largest participant in the 30 year treasury auction scooping up 59.29% of the available issue back in October of 2012. In the most recent auction from November 2022 the largest participant was the indirect bidder scooping up 51.68% of the available issue.
It should also be noted that almost $5 trillion, $4,878,356,992,900, has been tendered over the last decade of which only $2,271,743,946,400 was accepted meaning that the aggregate amounts bid have been more than twice the size of what was accepted over that span.
Key Takeaways
After reading this piece I imagine that many folks will have been surprised to learn that the Fed is the smallest of the competitive bidders at auction. Over the last decade directs, indirects, and primary dealers have all purchased more U.S. debt than the Fed; in the case of indirects in particular almost 5 times as much. Despite the largest aggregate of Fed interventions coming in August 2020 or later, interest rates continued to rise.
Over the last decade, primary dealers have tendered offers that are, on average, more than 5 times larger than what was accepted. What do they know that we don't?
Indirect bidders are, by far, the largest participants in the market for 30 year treasuries. While their average take down over the past decade is just north of 50% their market share continues to increase with time. It was only two months ago, in September, when indirect bidders took down more than 70% of the entire auction by themselves and, unlike the Fed, they have no reason to continue funding U.S. deficits unless there is something in it for them (hint: dollar liquidity).
Final Thoughts
I still believe that the reason yields on U.S. treasuries have continued to rise has more to do with an acute dollar shortage than anything else. Take India for example. Despite making an effort to replenish it's dollar reserves as of late the reserves at the Bank of India are still 14% lower than where they were at the beginning of the year just before the BOI had to aggressively sell dollars to defend the purchasing power of the rupee. The same type of defence was likely also true in regard to both the euro and pound, the former sinking to a 20 year low against the dollar while the latter sunk to almost a 40 year low.
As global dollar liquidity stabilizes, if only for a bit, there are two key items I am keeping an eye on: foreign demand and the treasury yield curve. With respect to the former this tweet from Jeff Snider indicates that foreign demand for long end USTs is exploding.
This is why the yield curve is so heavily inverted. Foreigners are buying (yes, buying) record amounts of long end USTs, the notes and bonds. Don't they know the Fed is raising rates aggressively? Yep, and betting they're going to end. pic.twitter.com/2OnhtQhB2E
— Jeffrey P. Snider (@JeffSnider_AIP) October 19, 2022
And as for the latter the yield curve has been horribly inverted since June with every single issue, including the 4 week bill, now yielding more than the 10 year note (even the 30 year bond has a lower yield than all but three other issues).
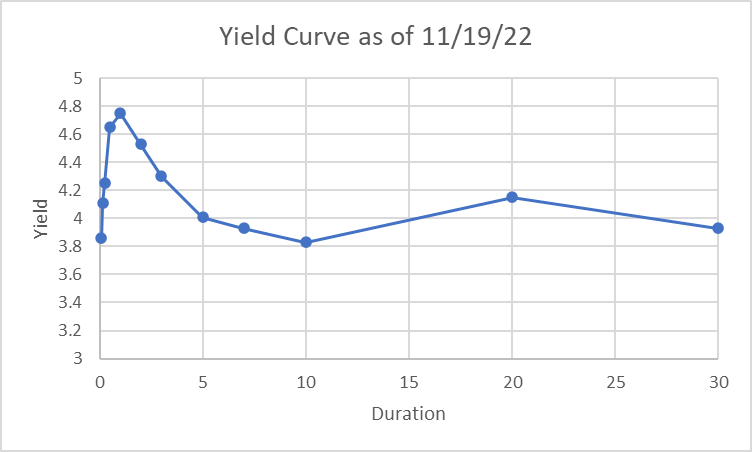
In short, not only is there robust demand for the 30 year bond, well beyond whatever support the Fed may provide, but the negative outlook for growth and inflation expectations being priced in by the badly inverted yield curve indicates that rates are about to head lower, much lower. Time to back the truck up.
Enjoying these posts? Subscribe for more
Subscribe nowAlready have an account? Sign in