Macro Chart Rundown for 4/26/2021

Welcome back to BTCM Research. Please subscribe if you are finding these chart updates informative. Today we examine Bitcoin, US Treasuries, crude, stocks, commodities, gold and silver, and the dollar!
Bitcoin
I can only speak for myself, but this recent dip has been rough. I was all set for the break out on the next leg of the bull market, everything looked great, but when the breakout came it was sluggish and FOMO never set in. Price rolled over and dove 25%.
The bounces along the way have come at expected times, including this most recent one. And so far it looks strong, retracing to the 38.2% Fibonacci line.
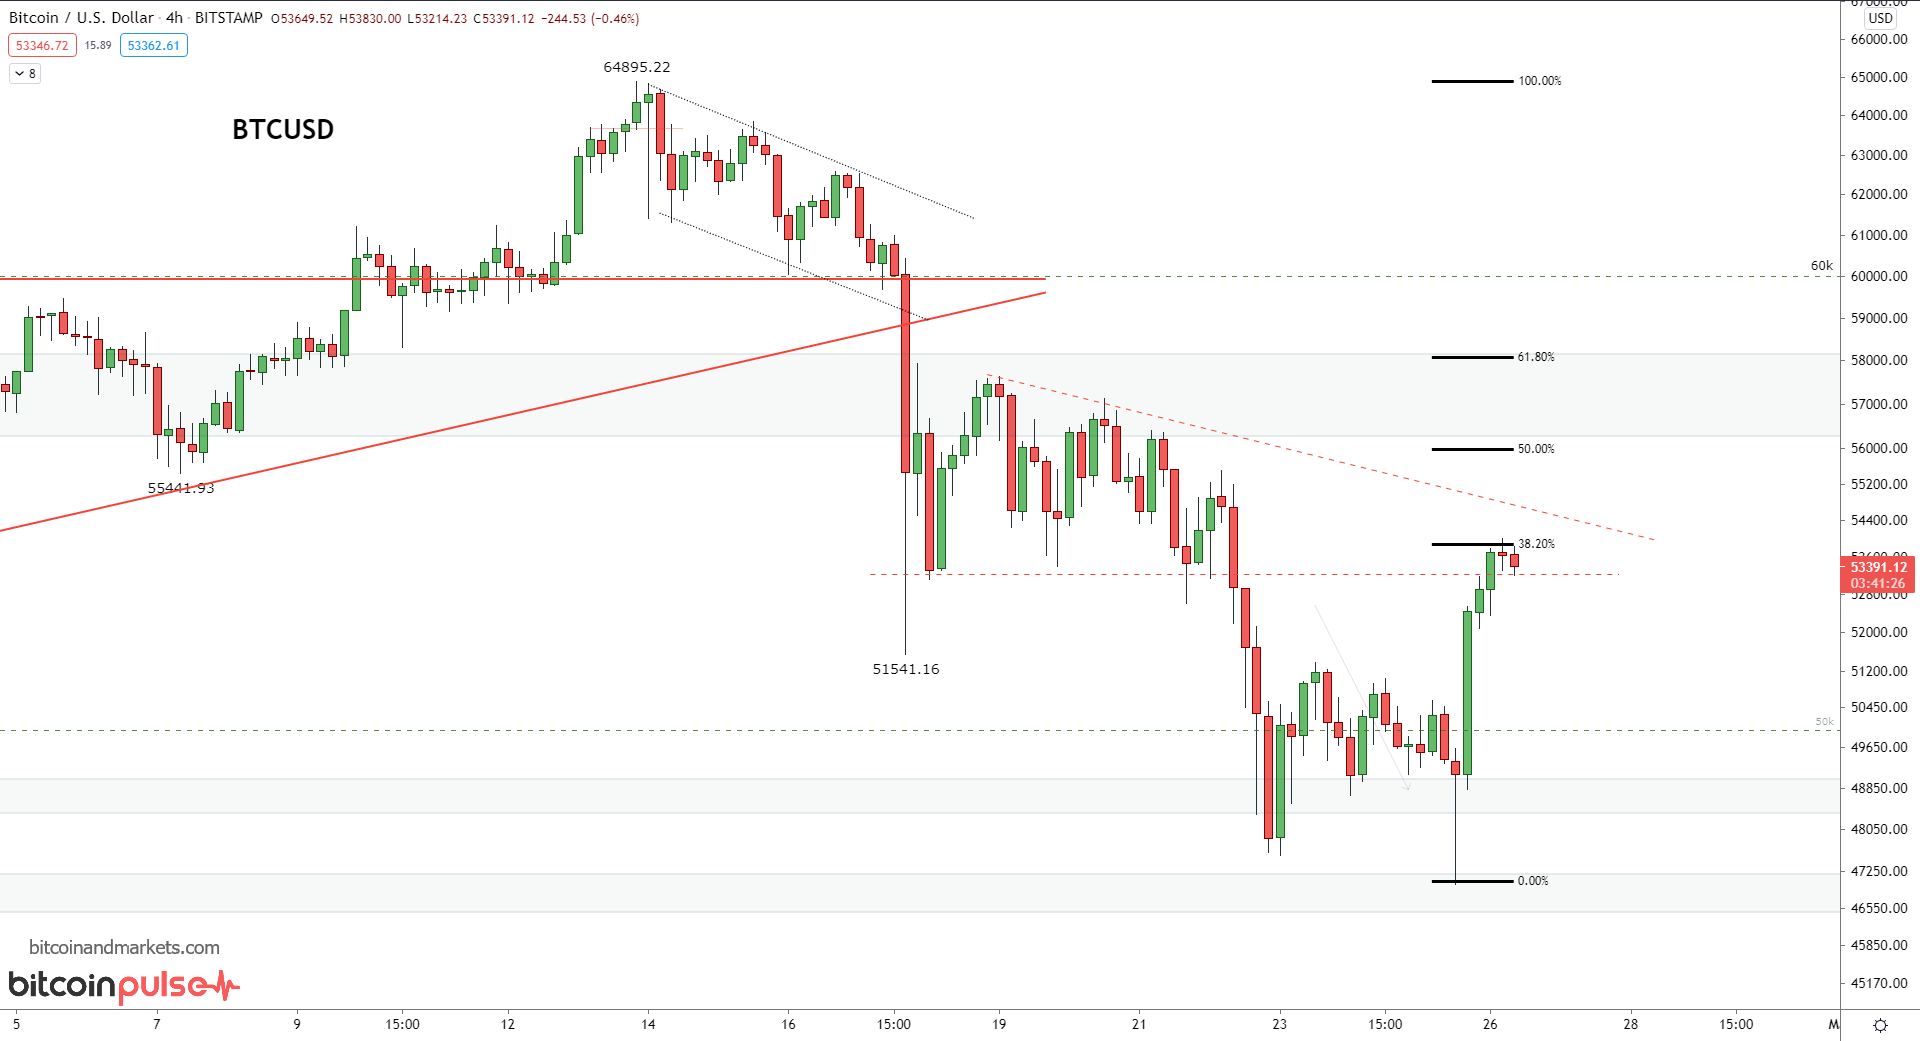
There is a lot of work to do for bulls still, but the last 12 hours have been a much needed sign of life. Of course, the rest of the year promises to be huge for bitcoin, so a little doom before the boom is called for.
Watch out when it breaks back above $58k, it will really take off after that in my opinion. For more technical analysis on bitcoin specifically, along with more macro commentary, subscribe to the Bitcoin Pulse at bitcoinandmarkets.com.
US 10Y Treasury Yield
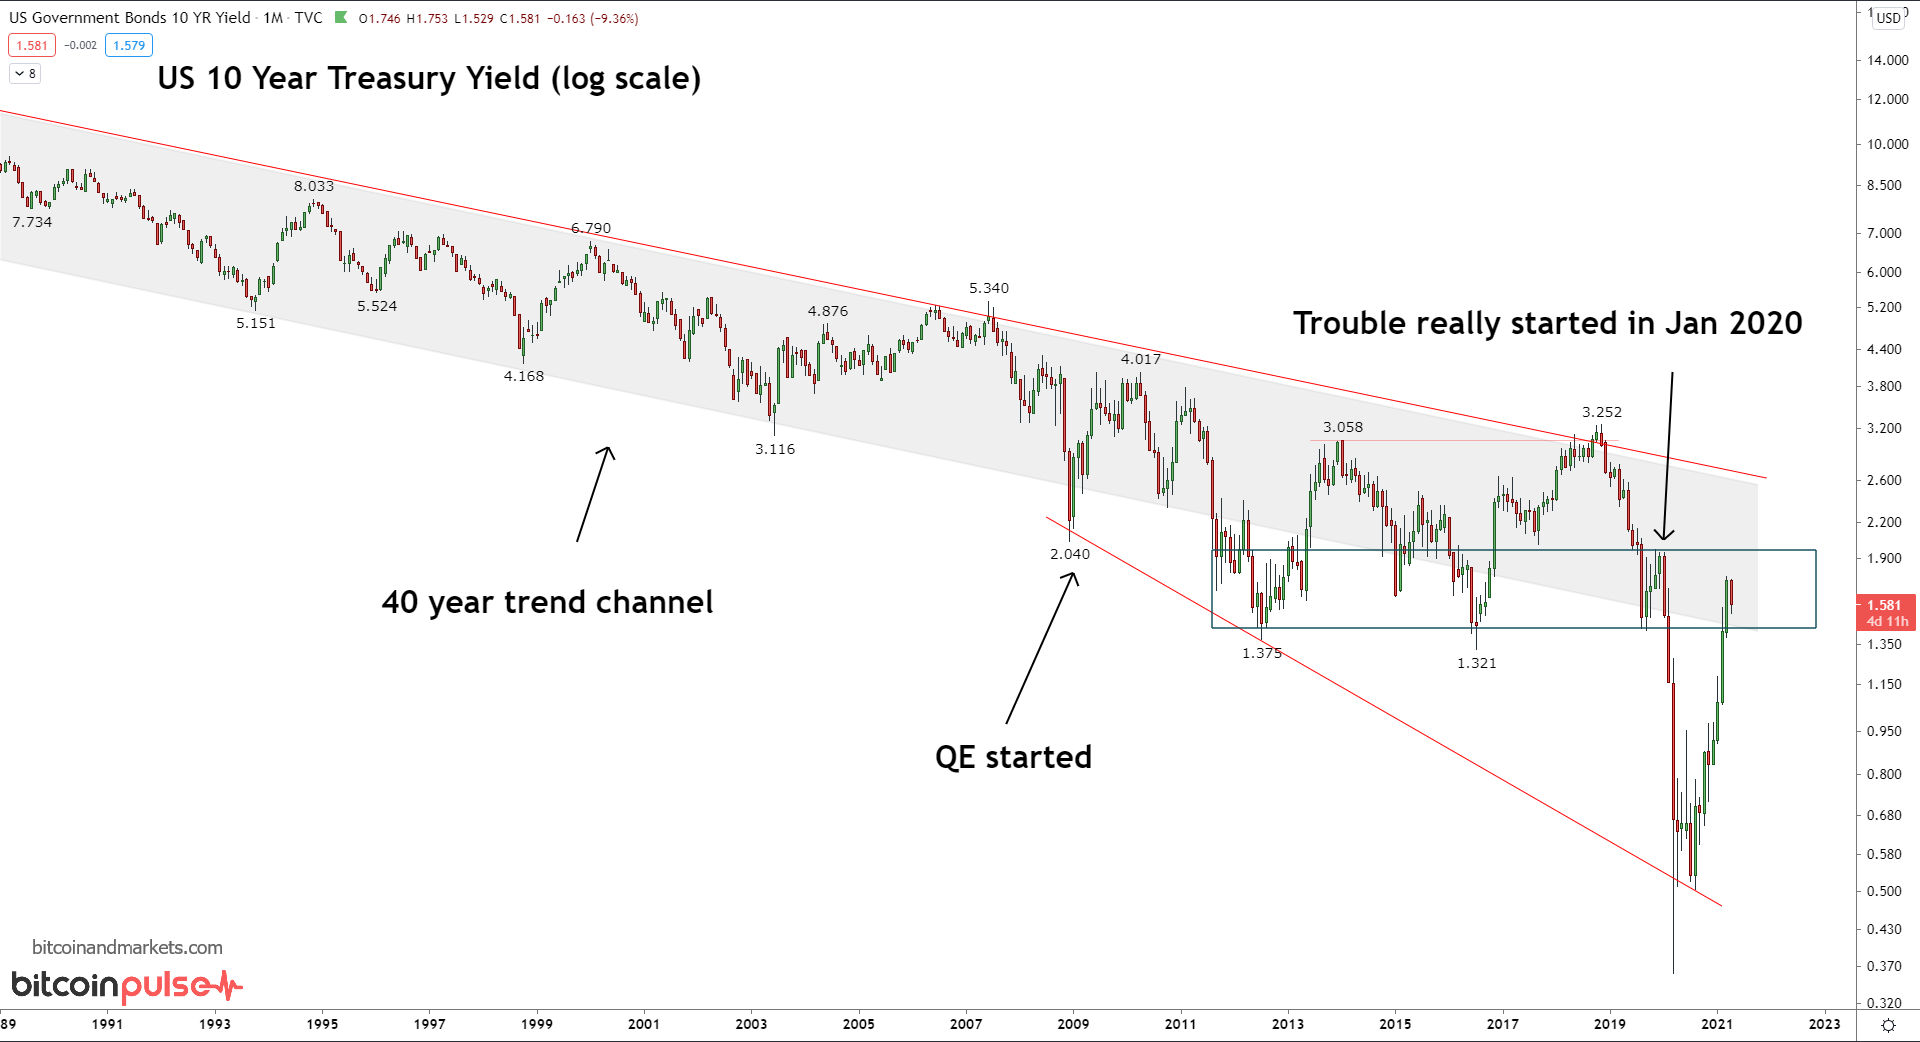
Zoomed out. Longer term Treasuries are running into some resistance in an obvious area. Comparing yields to the last few months will give you a false on this market. We must compare these yields to the last 40 years, when we do that, price is simply testing resistance at previous lows!
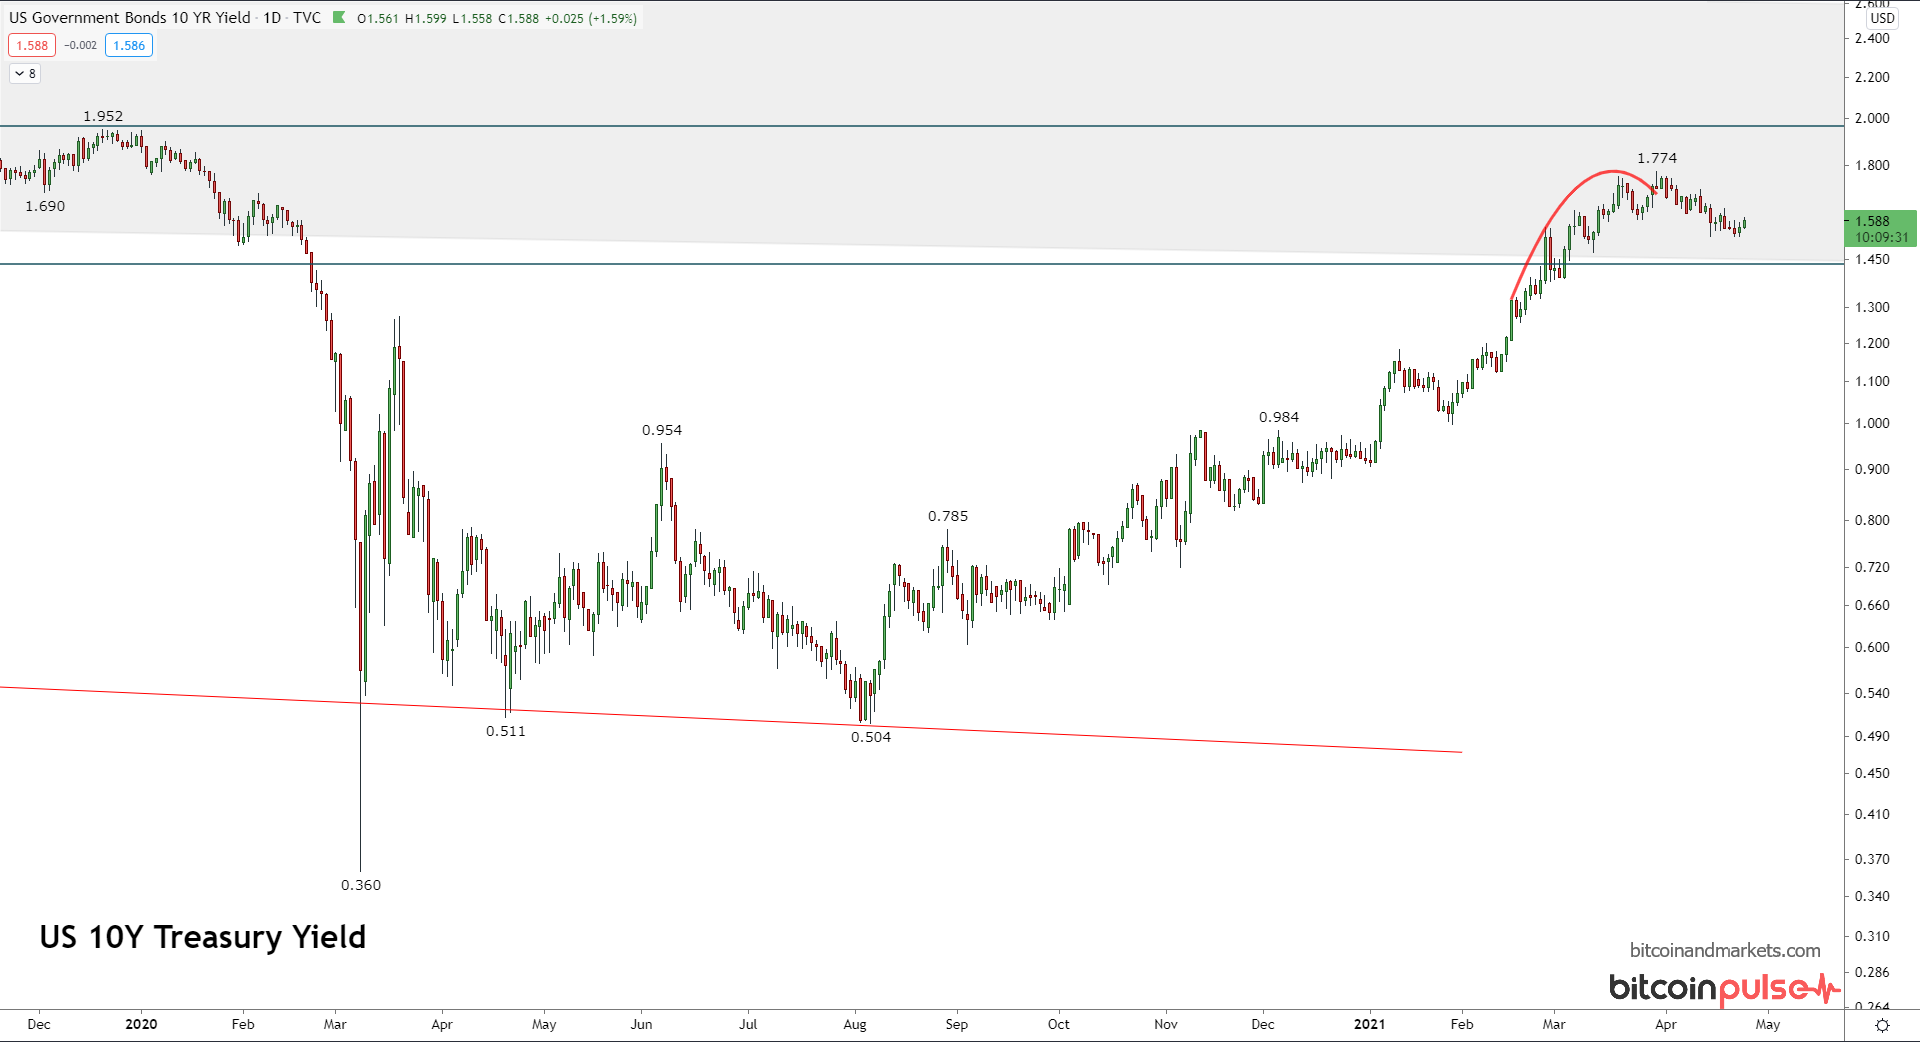
Zoomed in, this is the last 18 months or so. I predicted the red curve as yields pressed into the historic resistance zone. One thing is for sure, after 8-9 months of almost constantly rising yields (since the August 2020 low), yields are still only at previously historic lows!?!
TLT
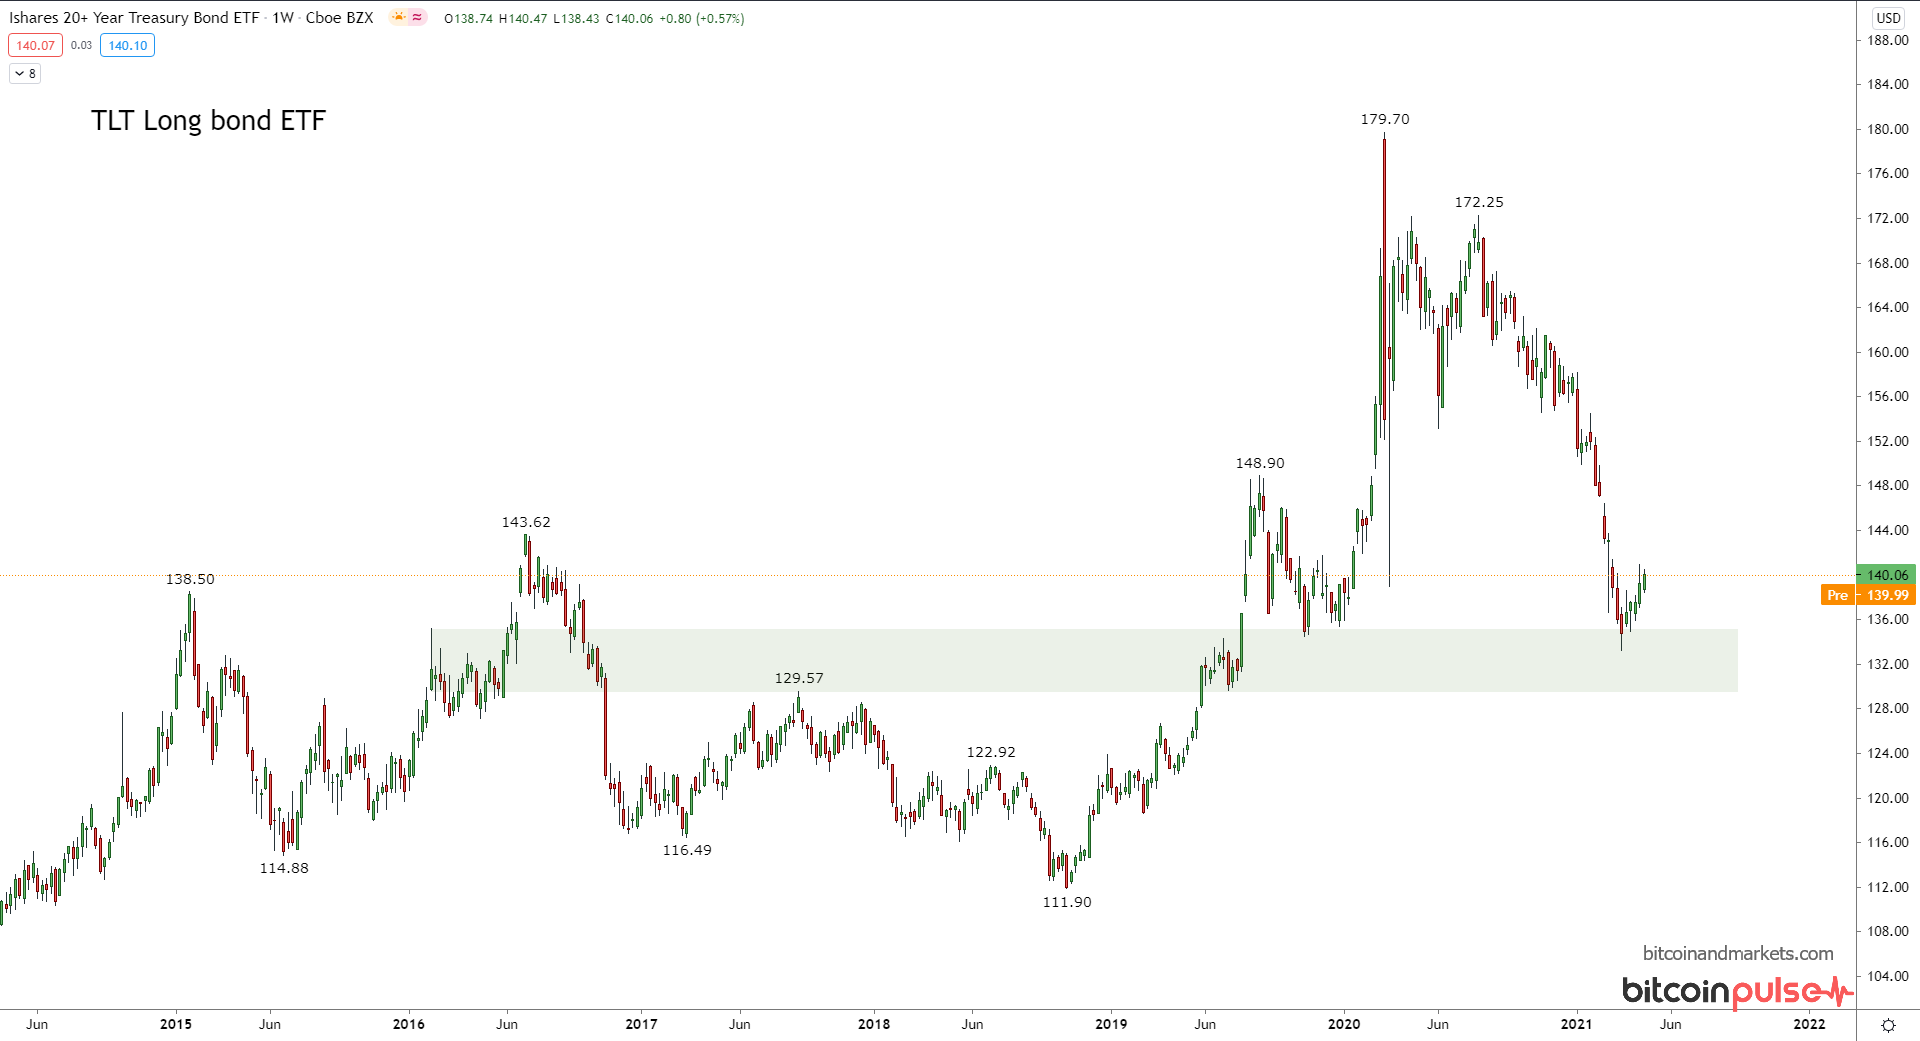
This ETF is the price of bonds, so it is the inverse of the above yield charts. As you can see, it has bounced on a support area. There is room, however, to go further downside prior to the ultimate bounce, but there is no sign of imminent doom as the inflationistas will claim.
WTI Crude
I've written several posts about the oil price going forward in the next few years. Above $60/bbl, US production will continue to climb. There is a natural (temporary) equilibrium around $60-$62 where several large US producers remain hesitant to drill new wells, but where smaller outfits can risk it and begin that process. Below $60/bbl less US production will be present, above $62/bbl there is a large increase in US production. Demand is not really an issue in my opinion because the market is operating on so much excess capacity it's all about supply.
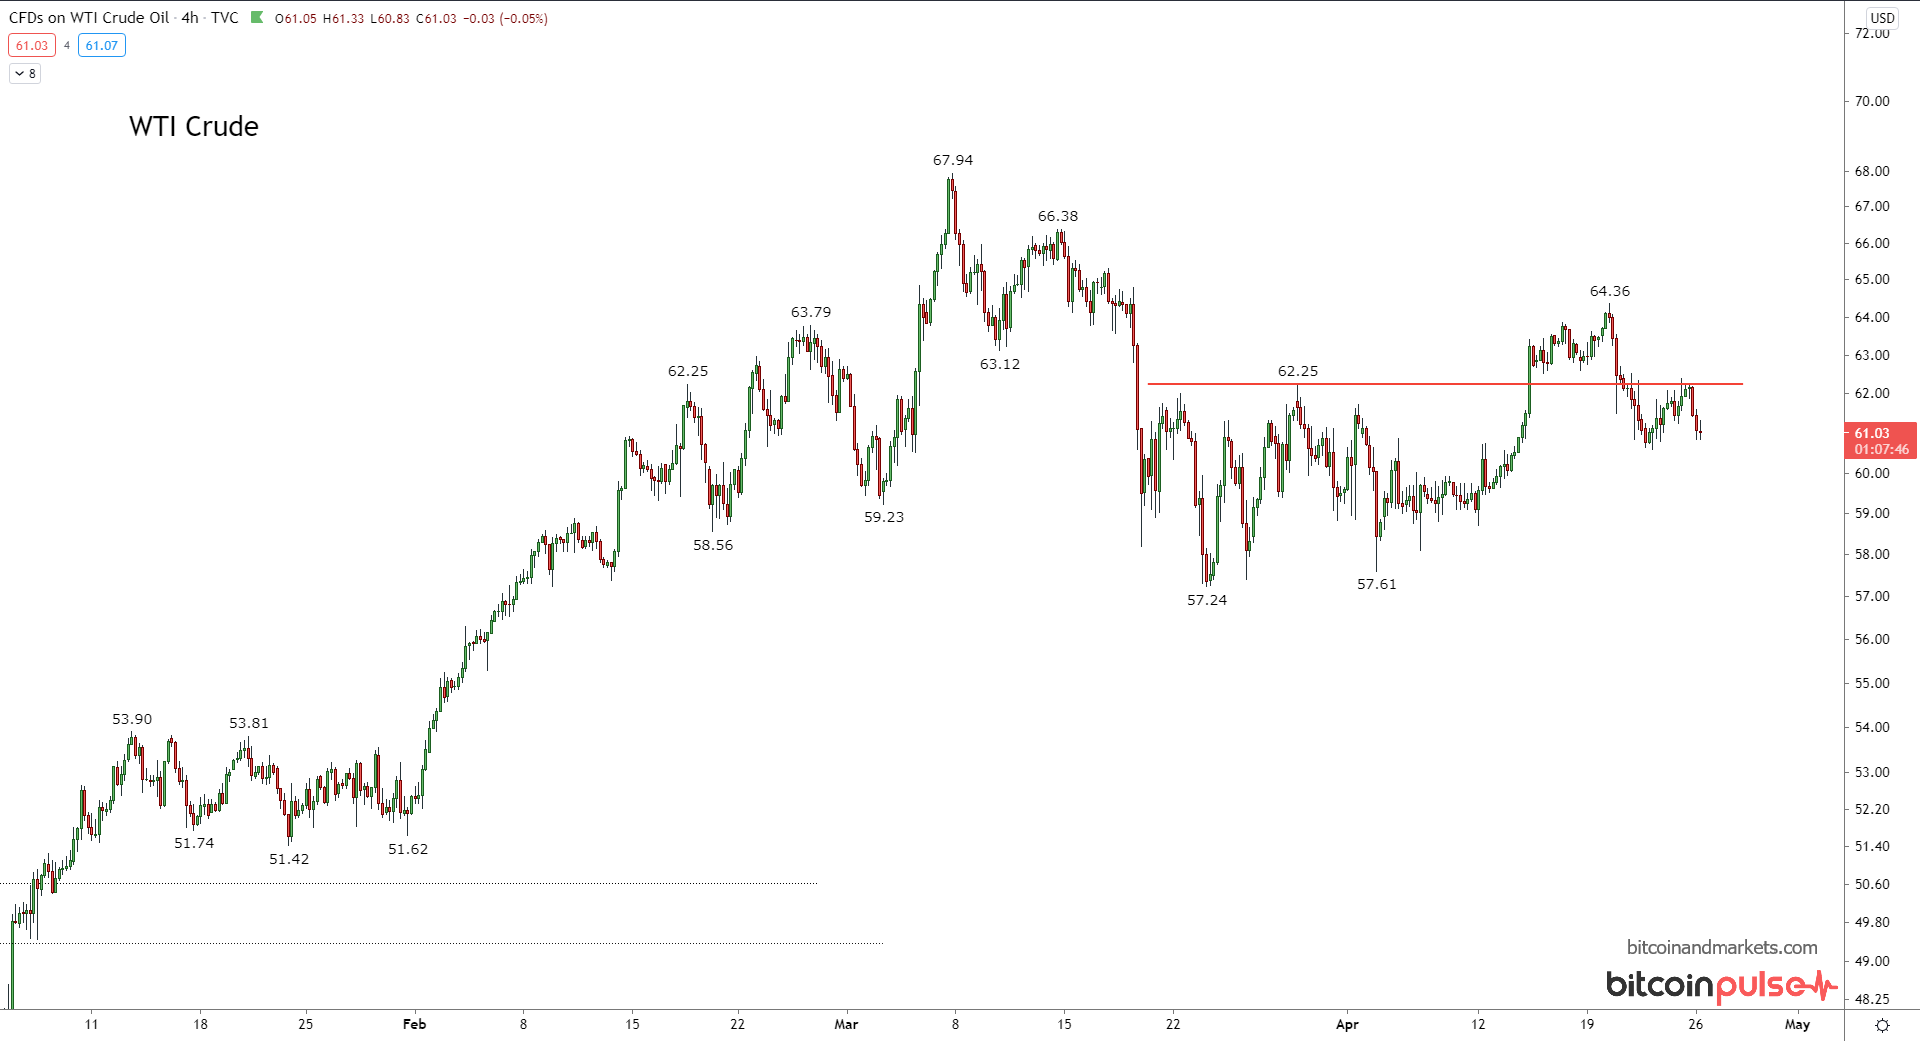
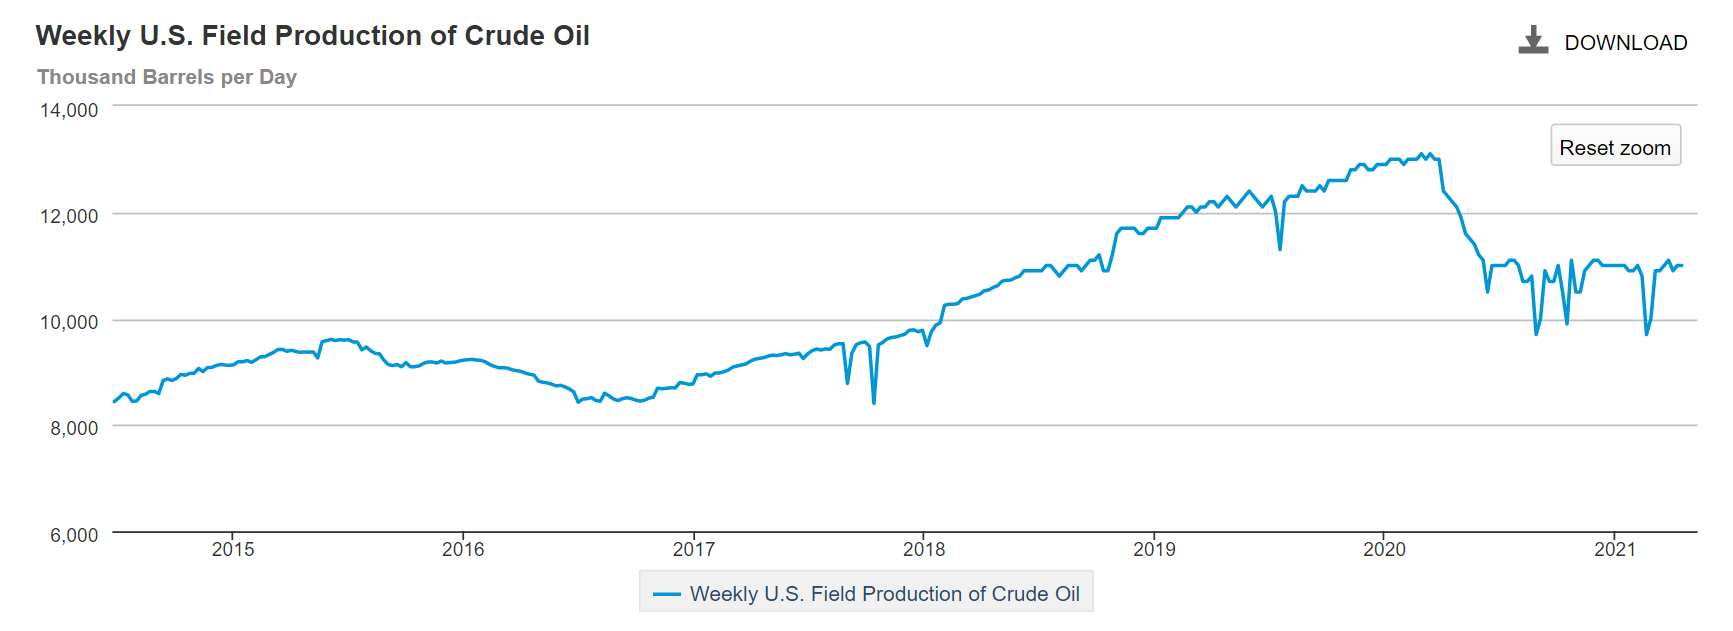
Above you can see that US production is stabilizing in an equilibrium zone. Higher prices threaten the return of 3 million bbl/day of production back online.
Stocks
I'm still bullish US stocks, again because global capital is looking for a place to go and the US is running a very large trade deficit, meaning all that money has to come back here into US assets. The chart has gone a long way up without a significant set back, so I wouldn't be surprised by that in the next couple of months, but over the next year US stocks should continue up, dips are buying opportunities for sure.
I'm aware this is counter to many pundits, even in the mainstream financial press. It is getting more and more popular to warn of an impending collapse. Everywhere you look people say that this bull market in stocks will end horribly. It probably will, but not anytime soon. Where else will money go today? The global economy is shot. Is there any place on the globe you'd feel comfortable investing capital in a business right now? There's no great options. The depression being brought on by deglobalization makes money ultimately flow into US stocks, bonds, and bitcoin.
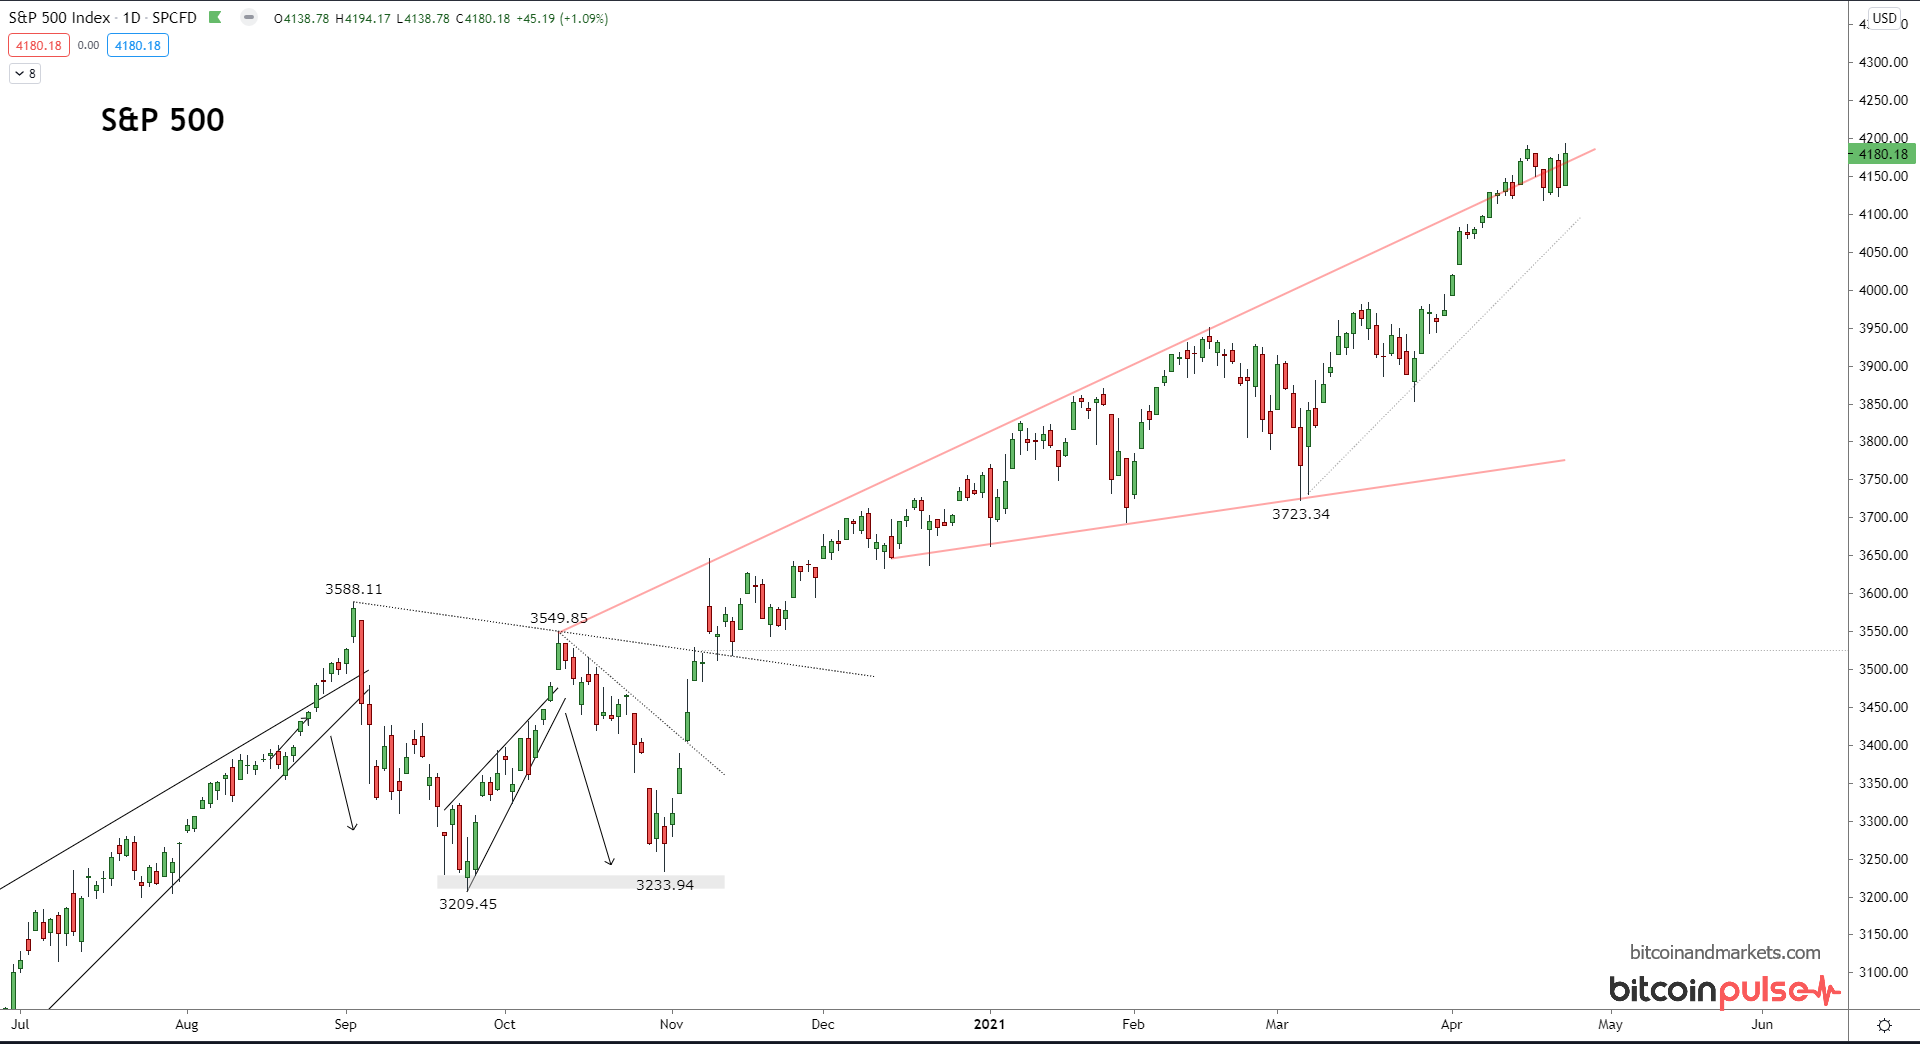
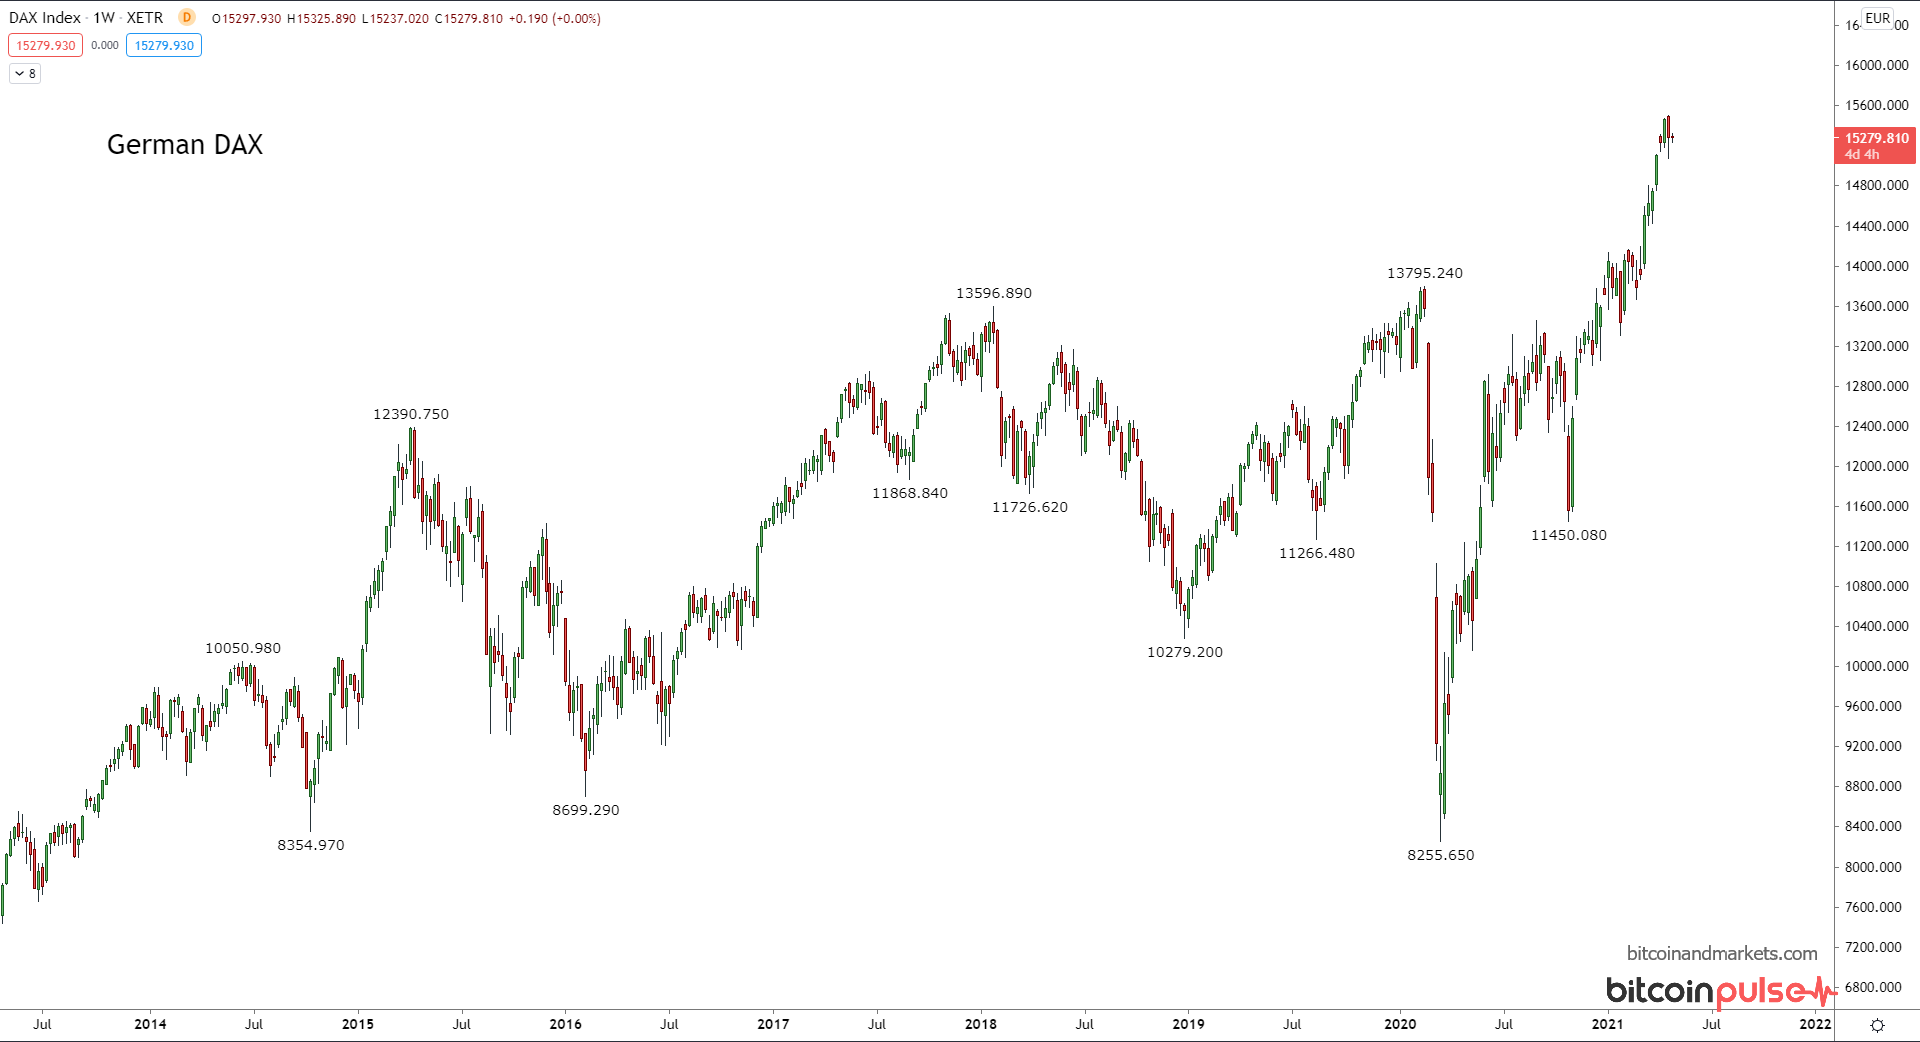
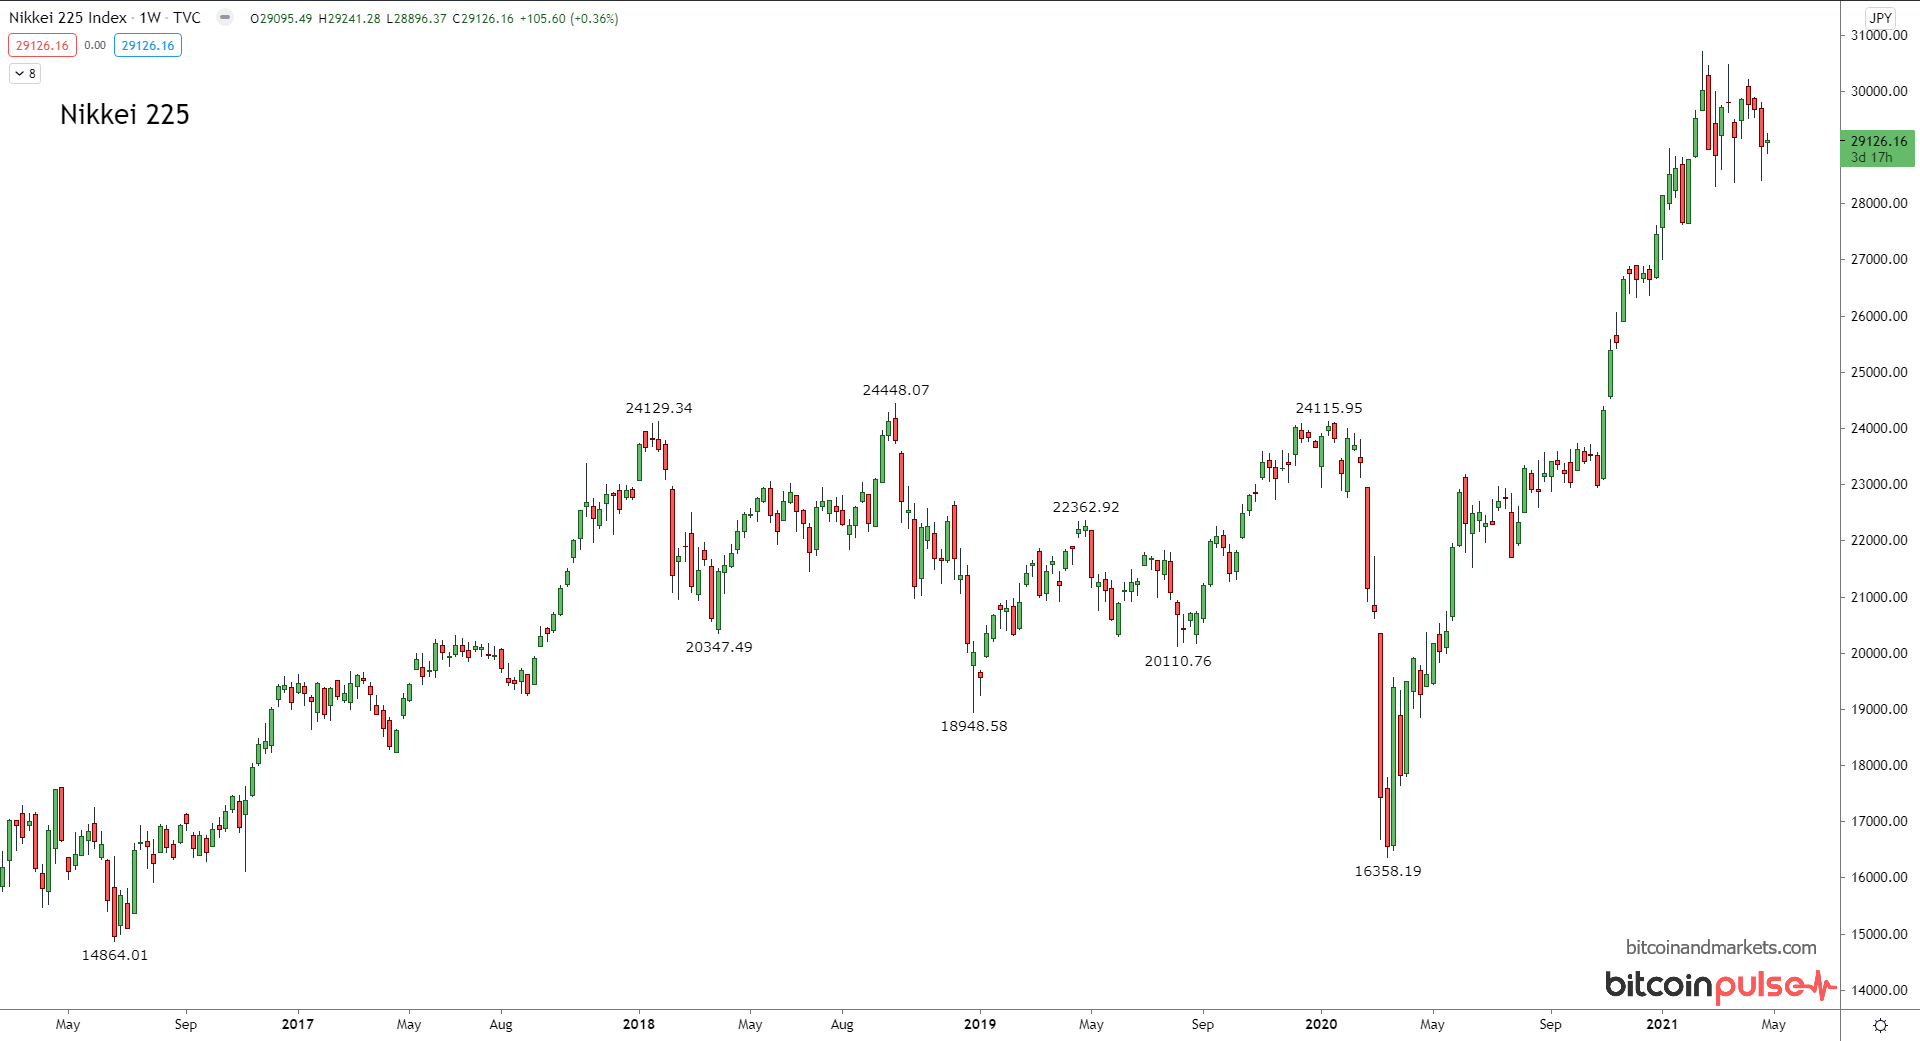
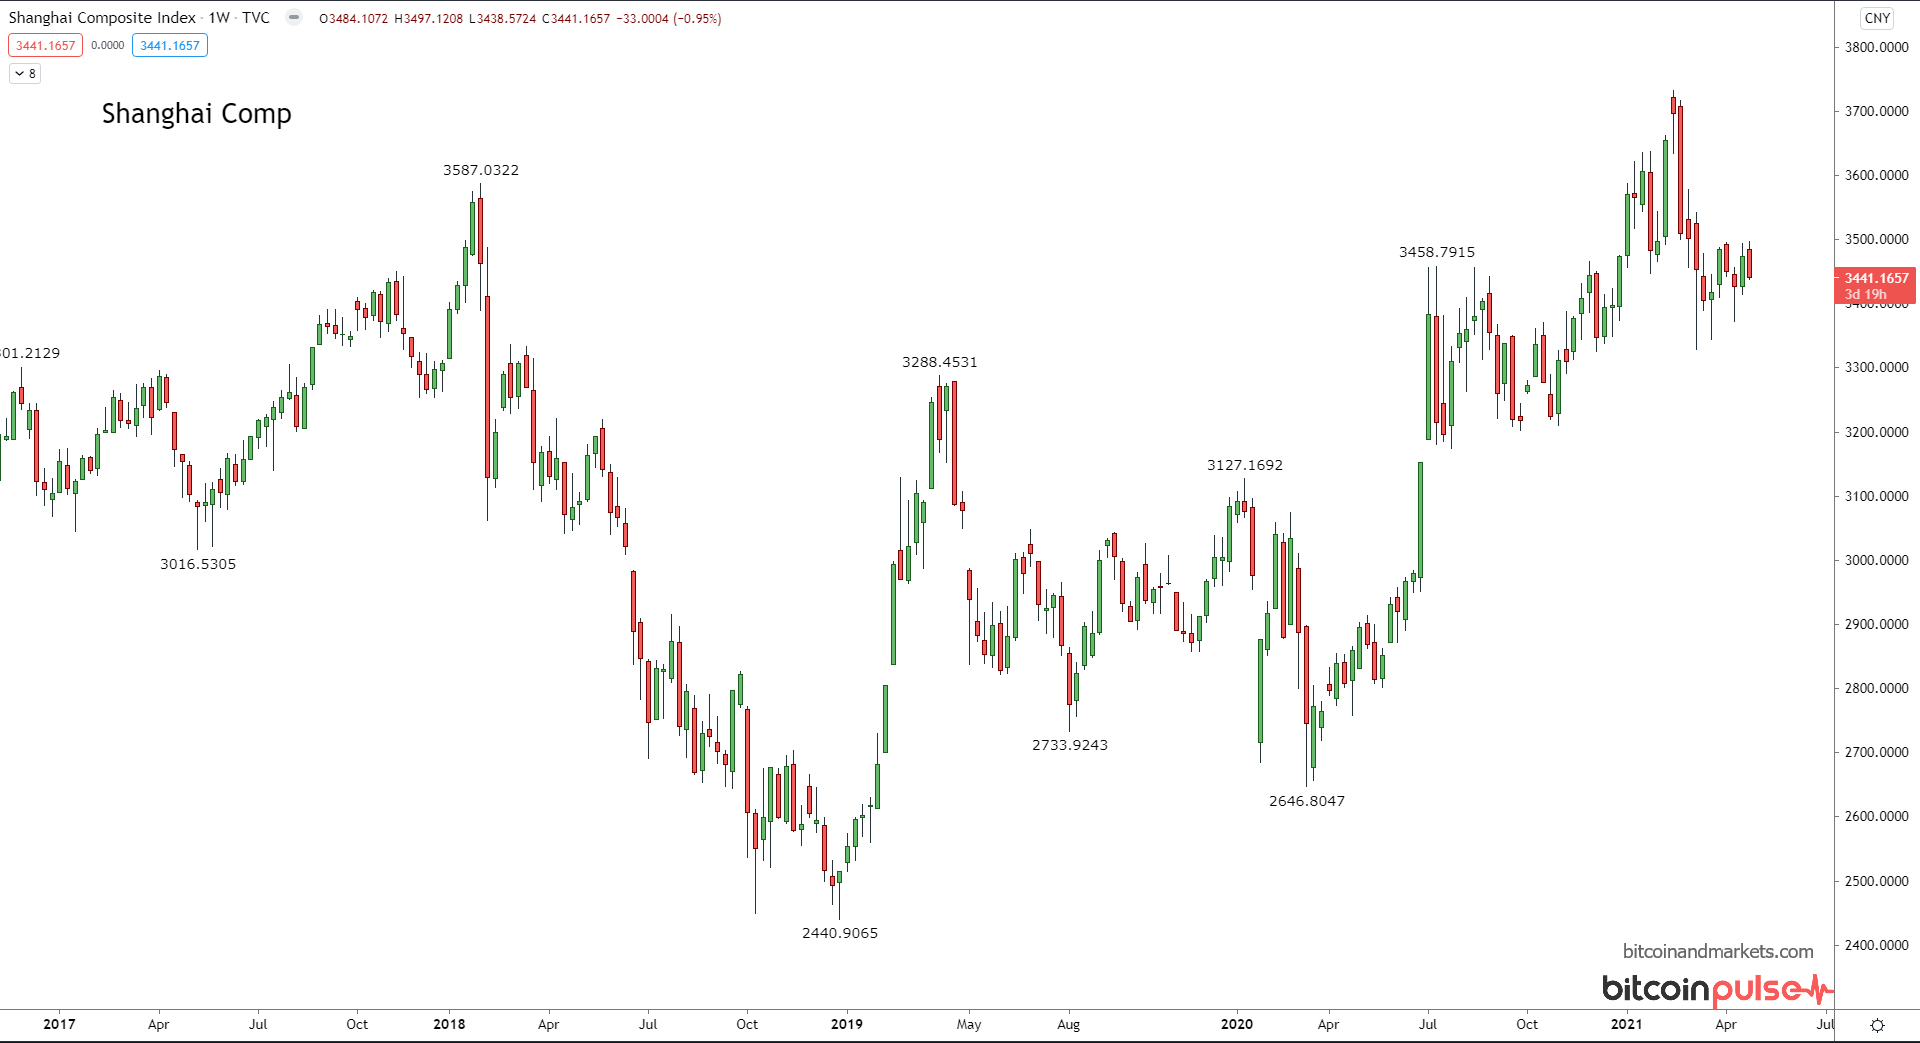
Quick rundown of major stock markets. These are weekly charts to give you a feeling of the last few years on each index.
Germany is looking strong, but more parabolic than US stocks, perhaps meaning the rally is less stable.
Japan same thing. It had a great rally for 1 year from the Corona bottom, but now have a lower high on the weekly chart. It looks like it wants to breakdown a bit, and support is very far away.
Shanghai composite hasn't had the same move as the other markets. It is at highs but barely, and the last few weeks have put in a couple lower highs. Asia seems like it wants to kick off a correction actually.
Commodities
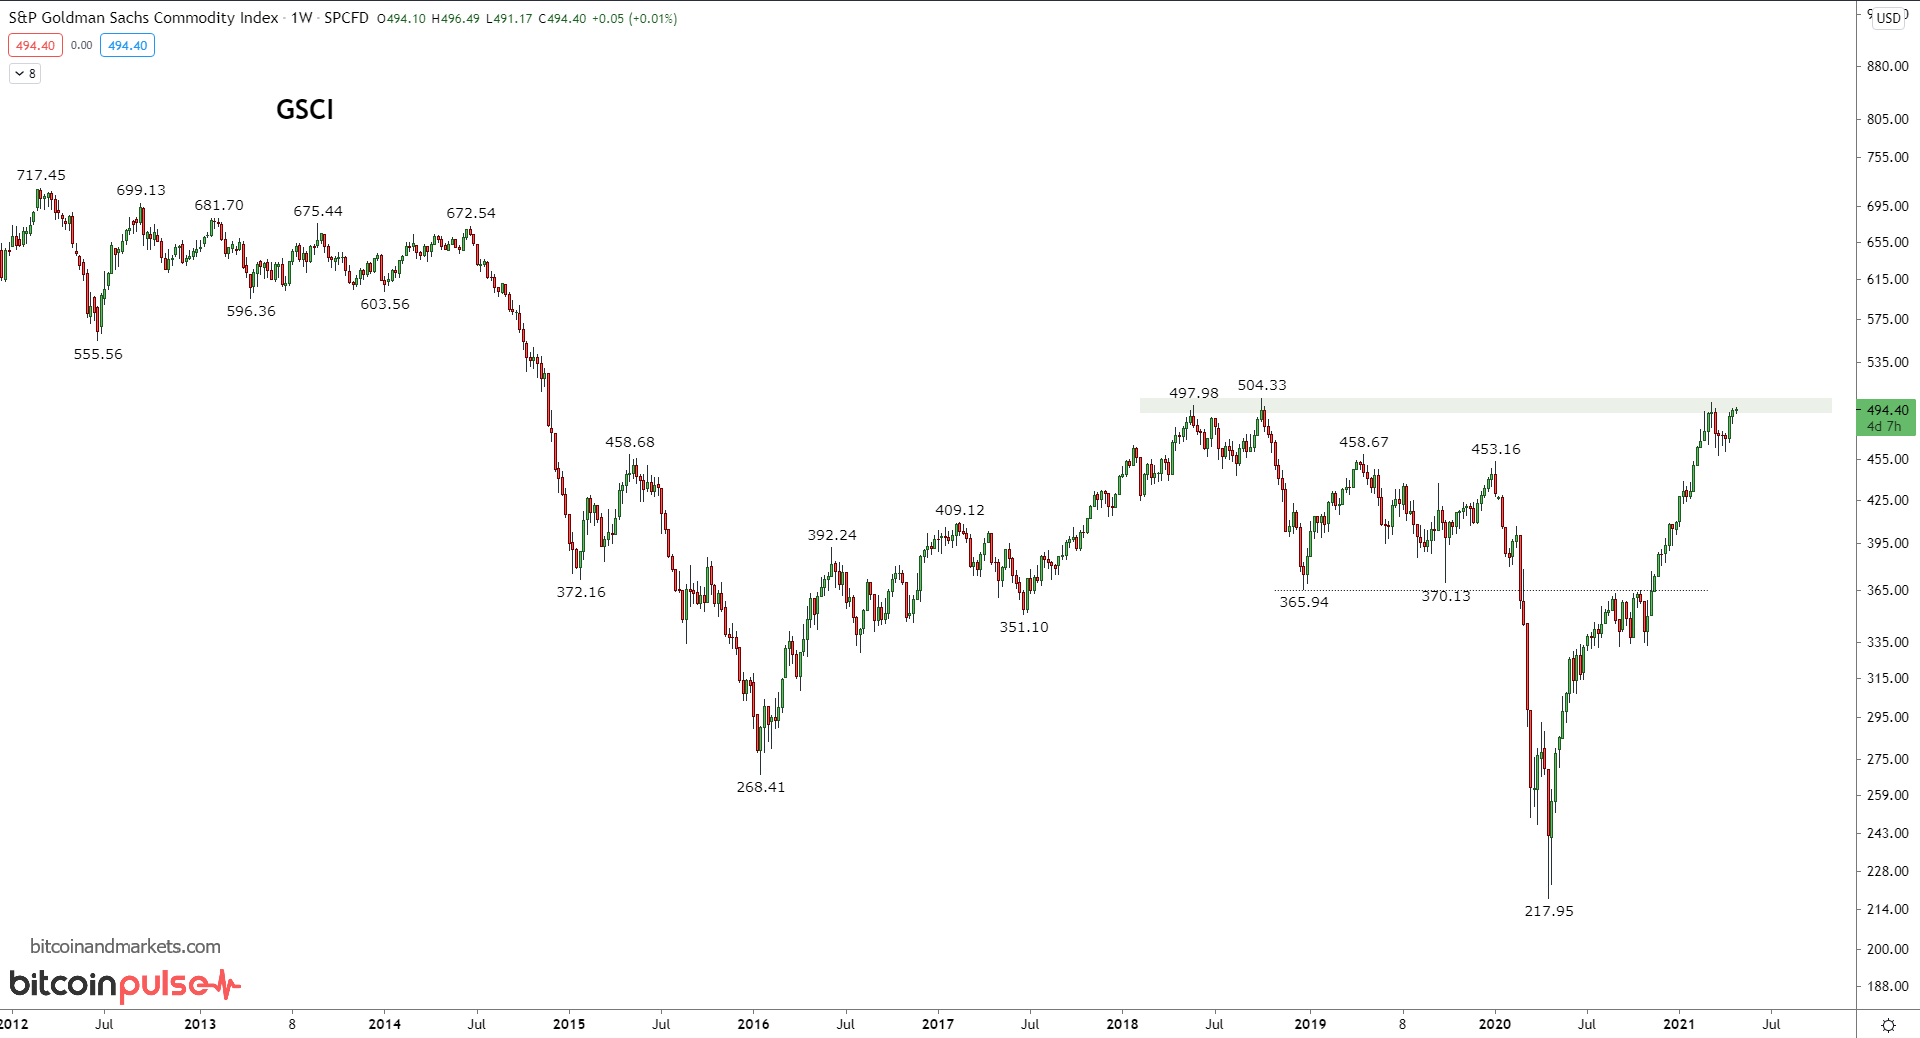
The Goldman Sachs Commodities Index is trying to test 2018 highs. This was the strongest rally in commodities since the 2008 Global Financial Crisis. Nothing would surprise me other than a continued rally to significantly higher prices. Prices might fake out above 2018 highs and then dive, or turn around here like it appears Treasuries are doing.
Gold and Silver
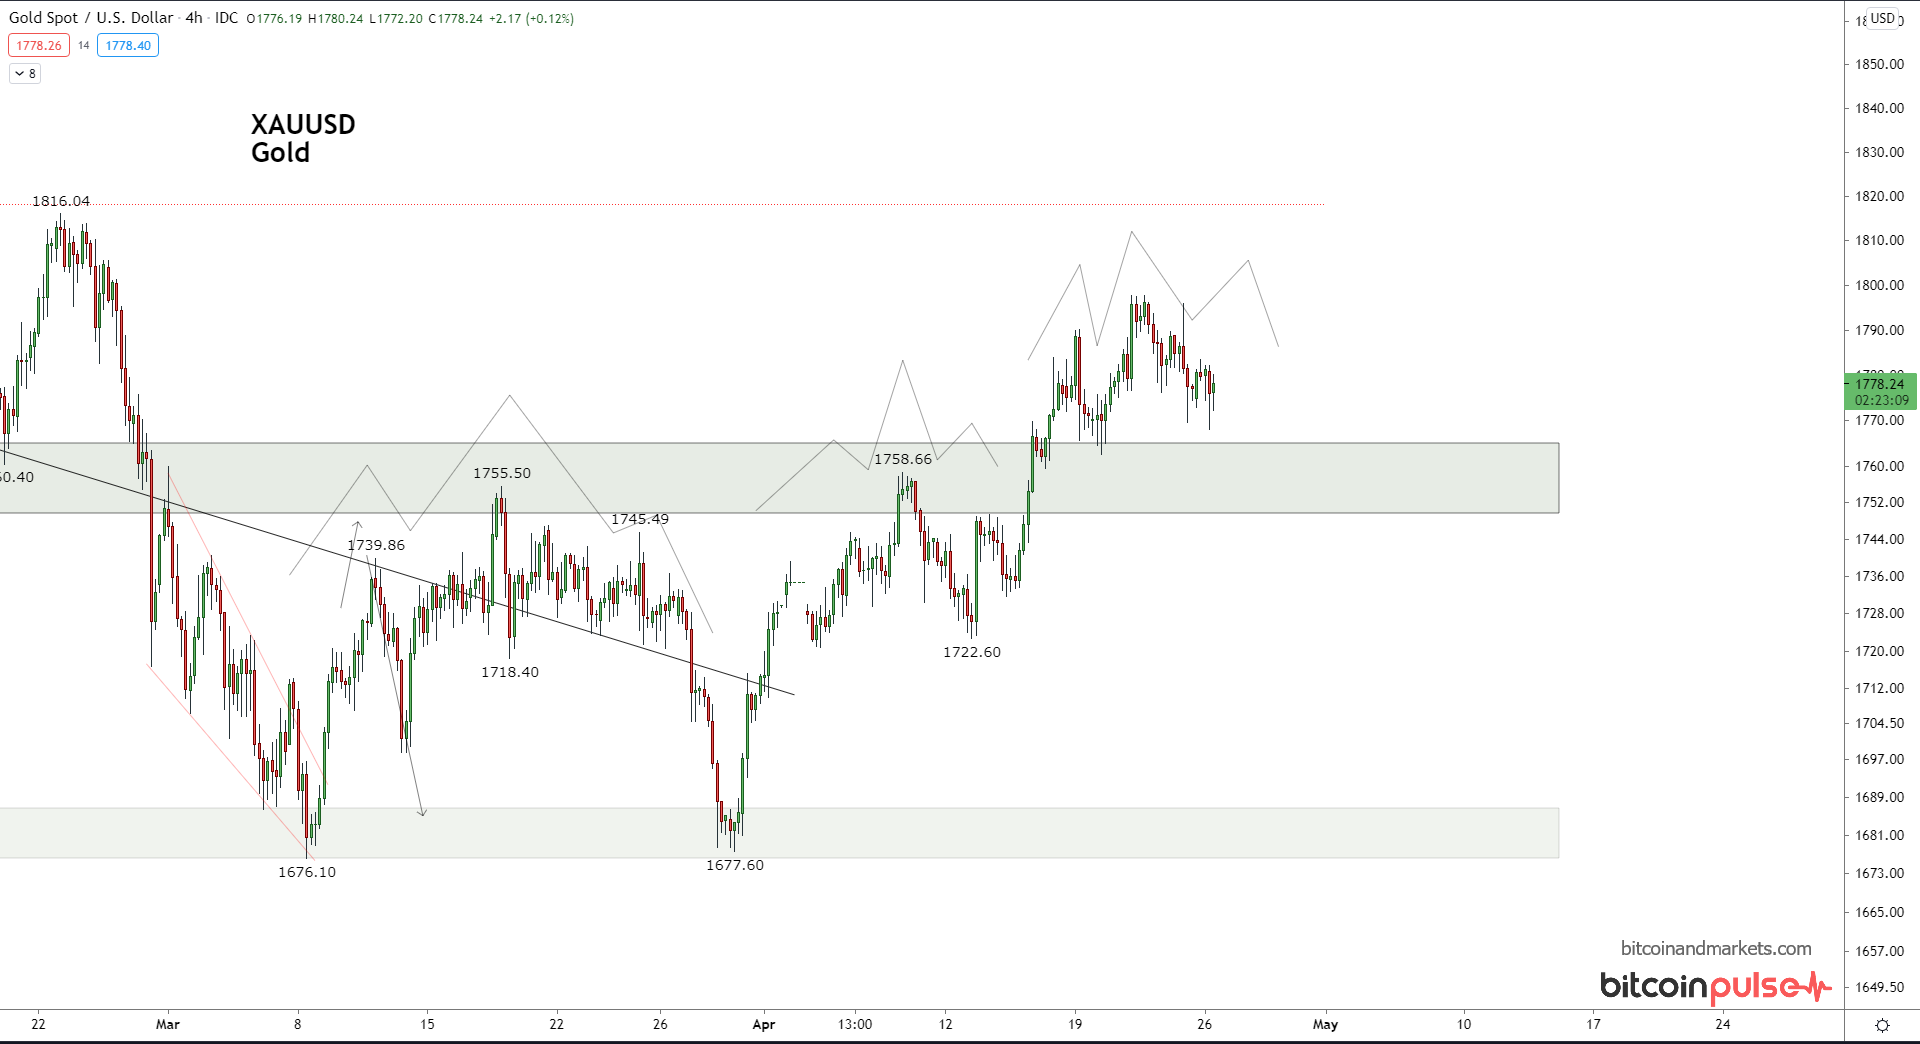
Gold put in a little rally up to just shy of $1800. Although it did break through the resistance around $1750 and has tested that level as support, its performance looks weak. It reminds me of bitcoin's performance a couple weeks ago when it broke $62k. Bitcoin really did look like the next leg up was starting, only to have it roll over and drop 25%.
I don't think gold or silver are in for that kind of drop, it there is a higher likelihood in my opinion for this weak breakout to fail and roll back over. Remember, 2008-9 saw a 35% slide in the price during the financial crisis after breaking the previous ATH. A 35% slide would be all the way to $1350. I don't think it gets that low, but it's only been 20% so far from the recent ATH. Getting down to $1550 would be 25% and that is a good range in my mind.
Of course, it's coming up on a decision point once again, so let's see what happens.
Silver
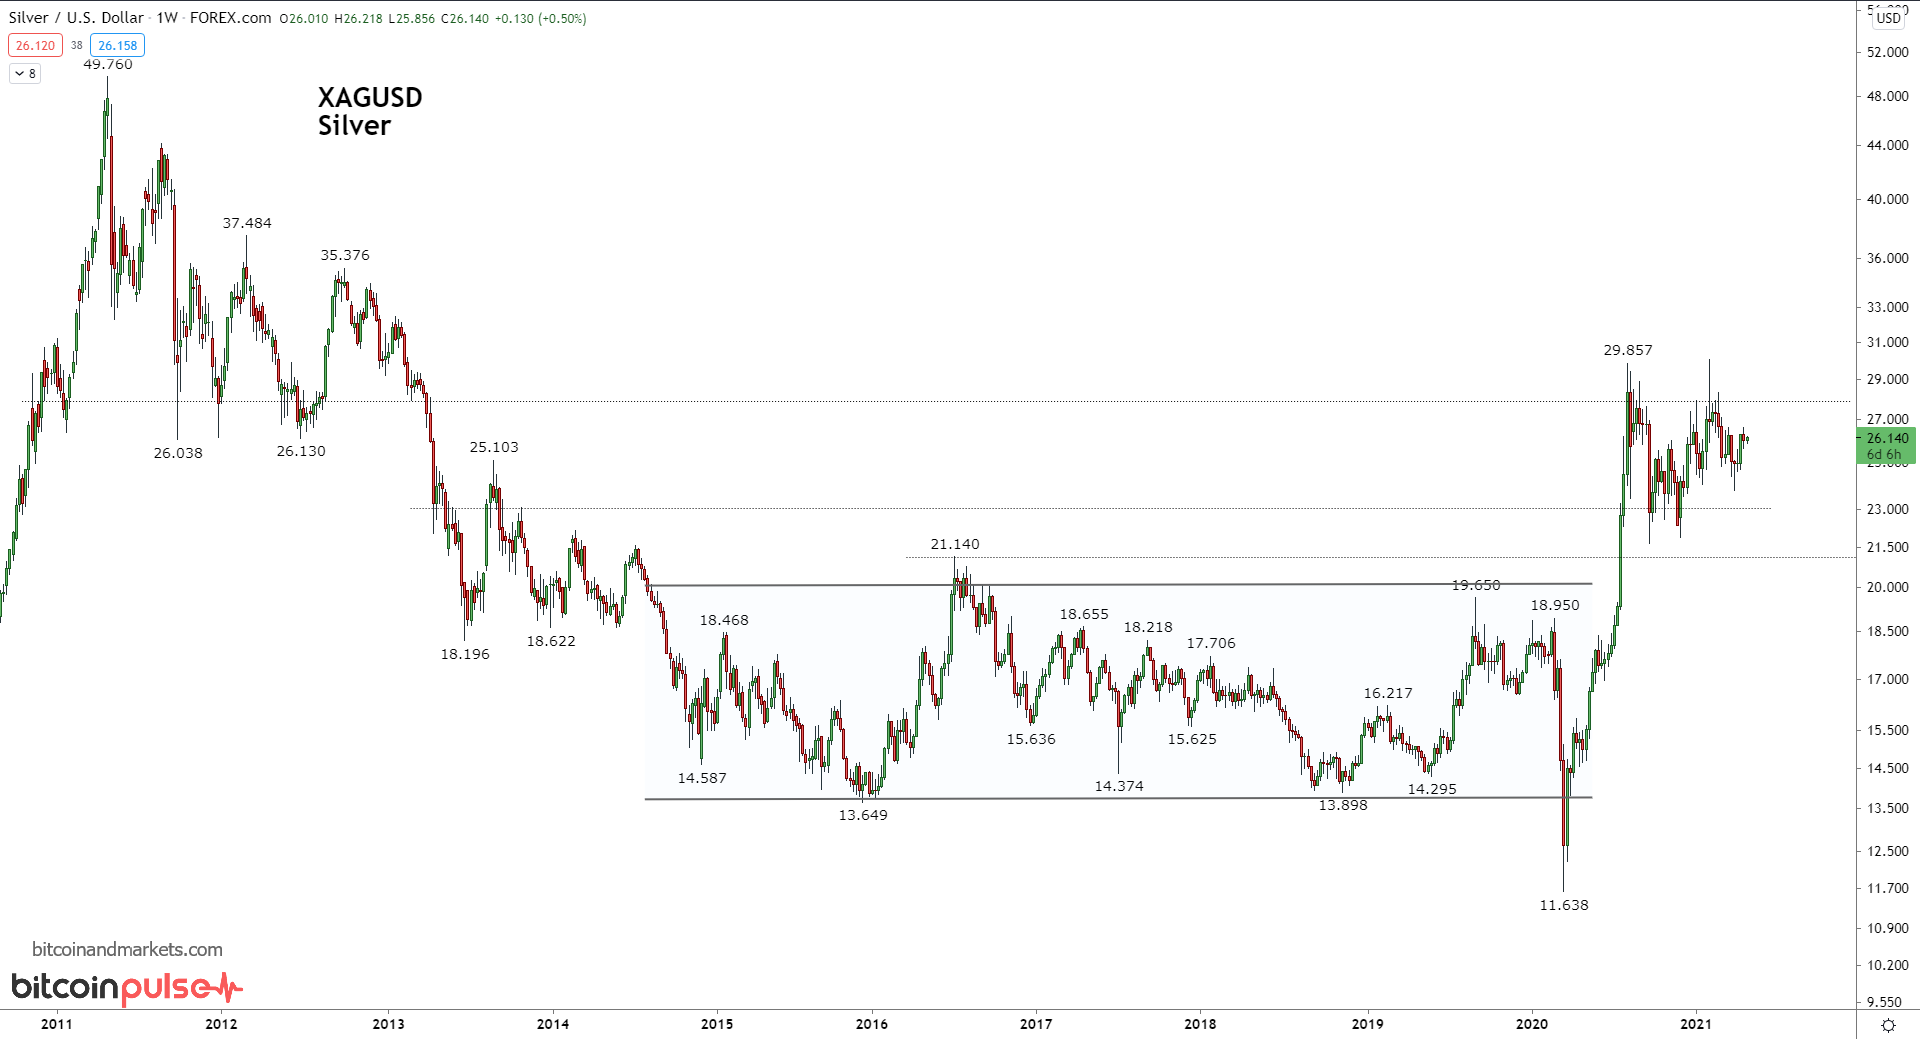
The long term chart for silver is very boring. It did definitely breakout during 2020, which is nice to see, but it's currently in a no man's land. It's trapped between the topping pattern above and the 5 year consolidation zone below.
If silver can move without gold, I'd like to see a rising wedge form over the next 6 months and breakout higher. That being said, technically it would make sense to test that 5 year range down to $22 at some point in the future. Silver bugs should want that to happen sooner rather than later.
Dollar (DXY)
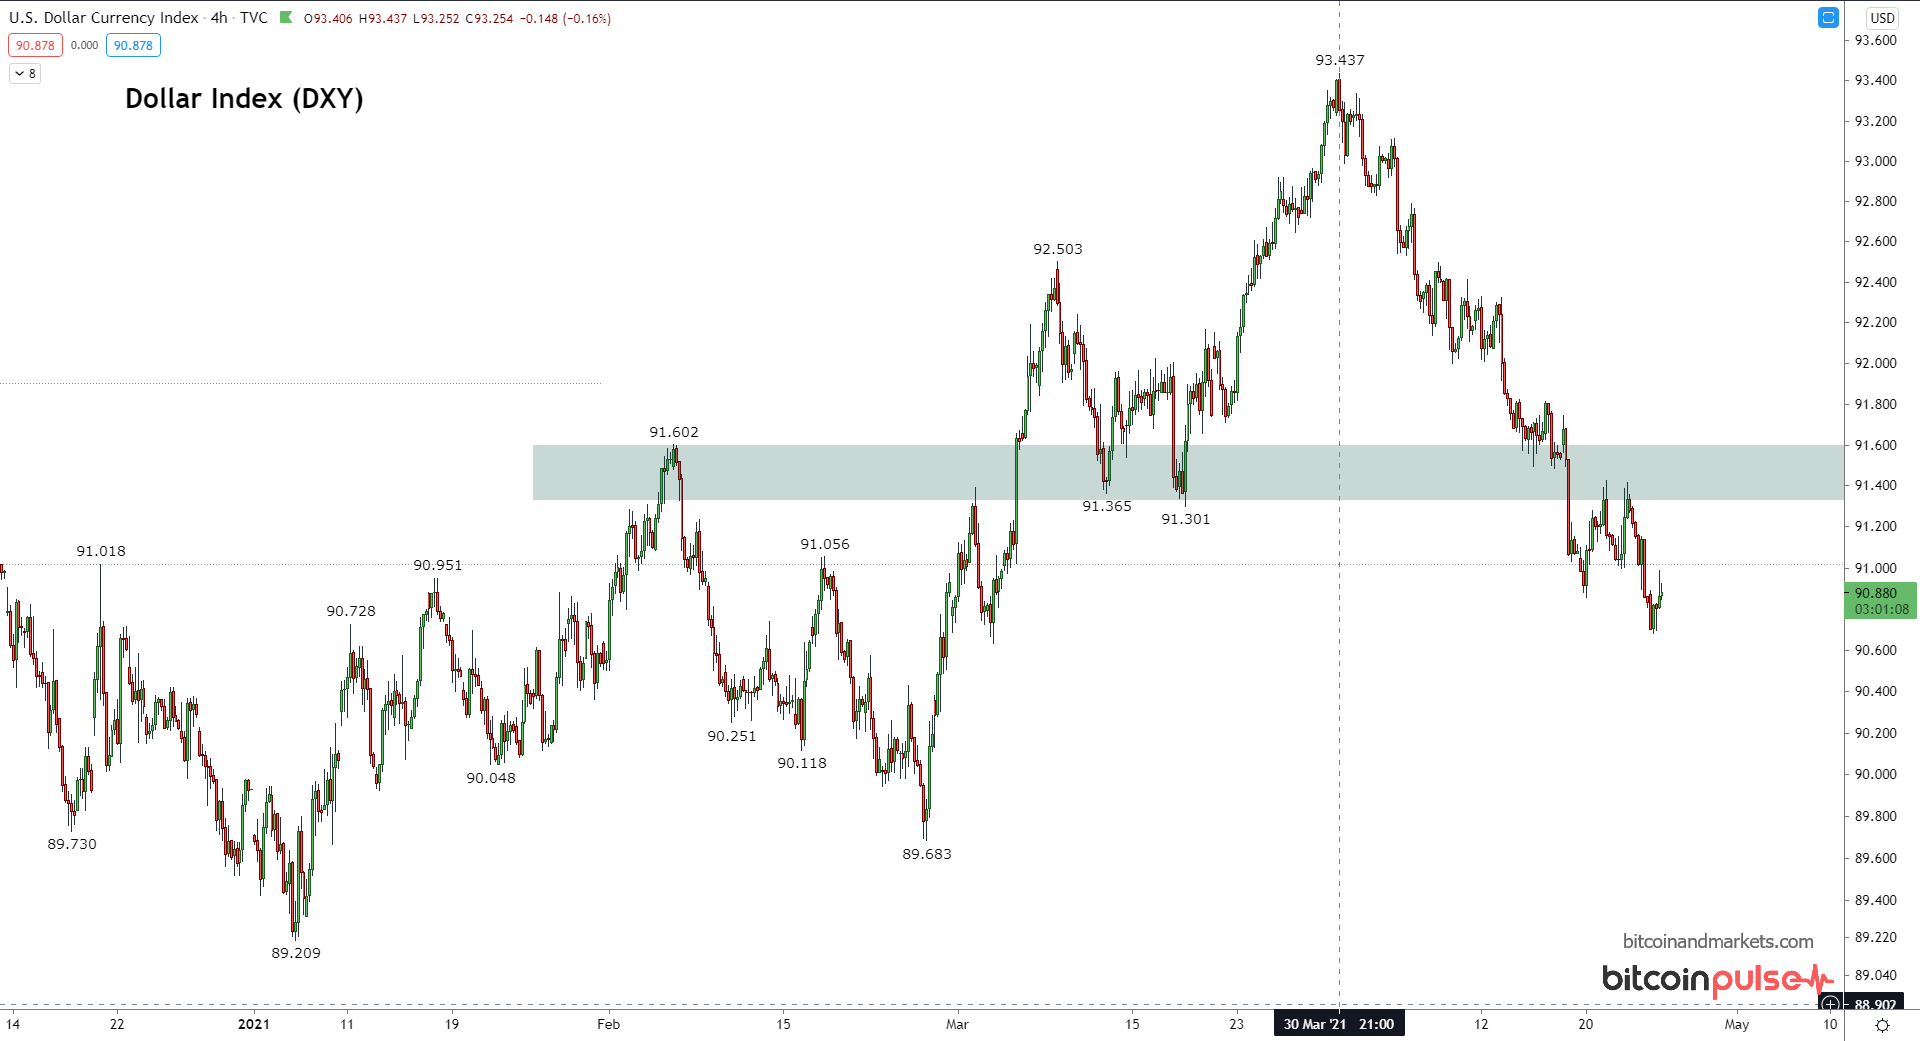
Let's end it with king dollar. I was surprised by the dollar breaking the shaded support area, and immediately back testing it as resistance and falling further (first chart below, 4hr). I am not expecting an significantly weaker USD anytime soon. If the insane monetary policy of the last 12 months cannot cause it to break 2018 lows, it won't do it now. The next phase is foreign currency weakness.
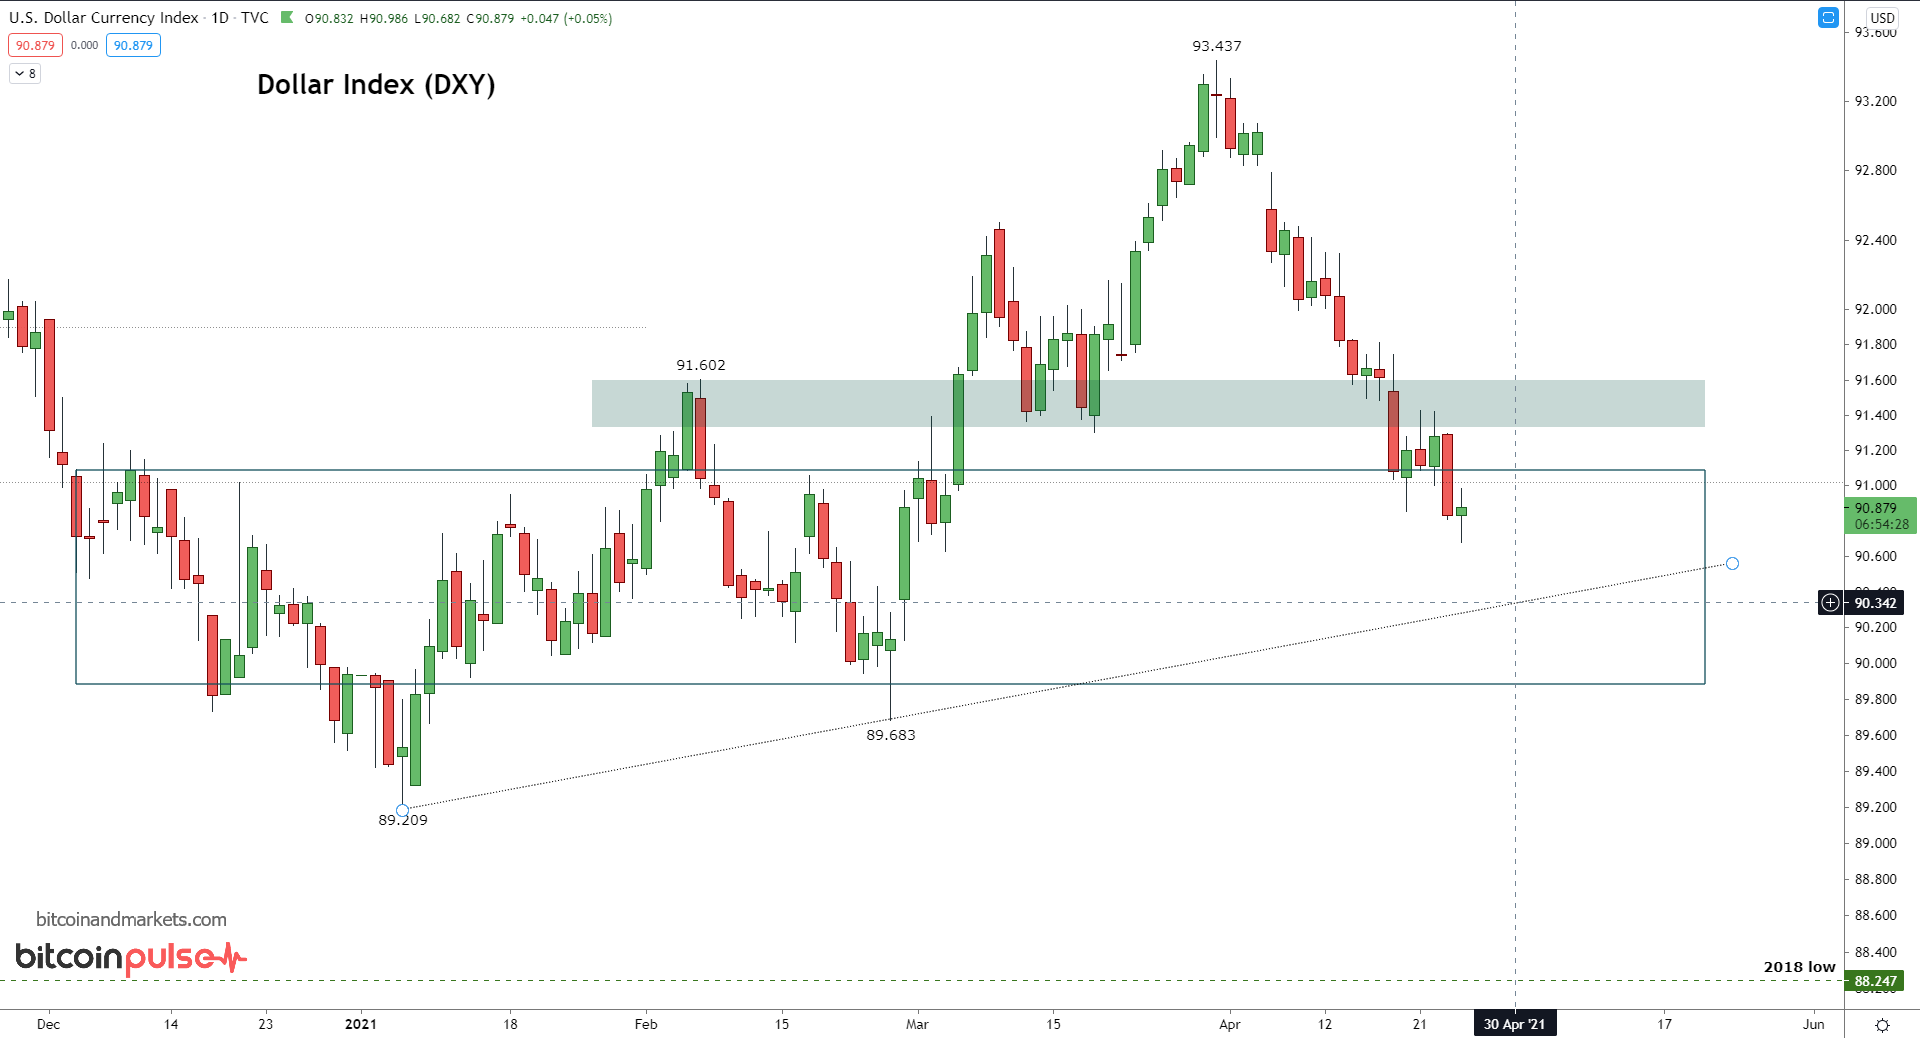
On the daily chart we have some diagonal support from the trend line connecting the lows, which is inside the outlined box that is a range the DXY spent a lot of time in during the last 6 months, so it should provide tons of support. That is the last line in the sand, 90.3. If it breaks below that level, new cycle lows are likely.
However, when the dollar wants to strengthen, which is where I think the dollar is, it can move very quickly. If it breaks back through the shaded area toward 92, it is likely to rally hard and fast.
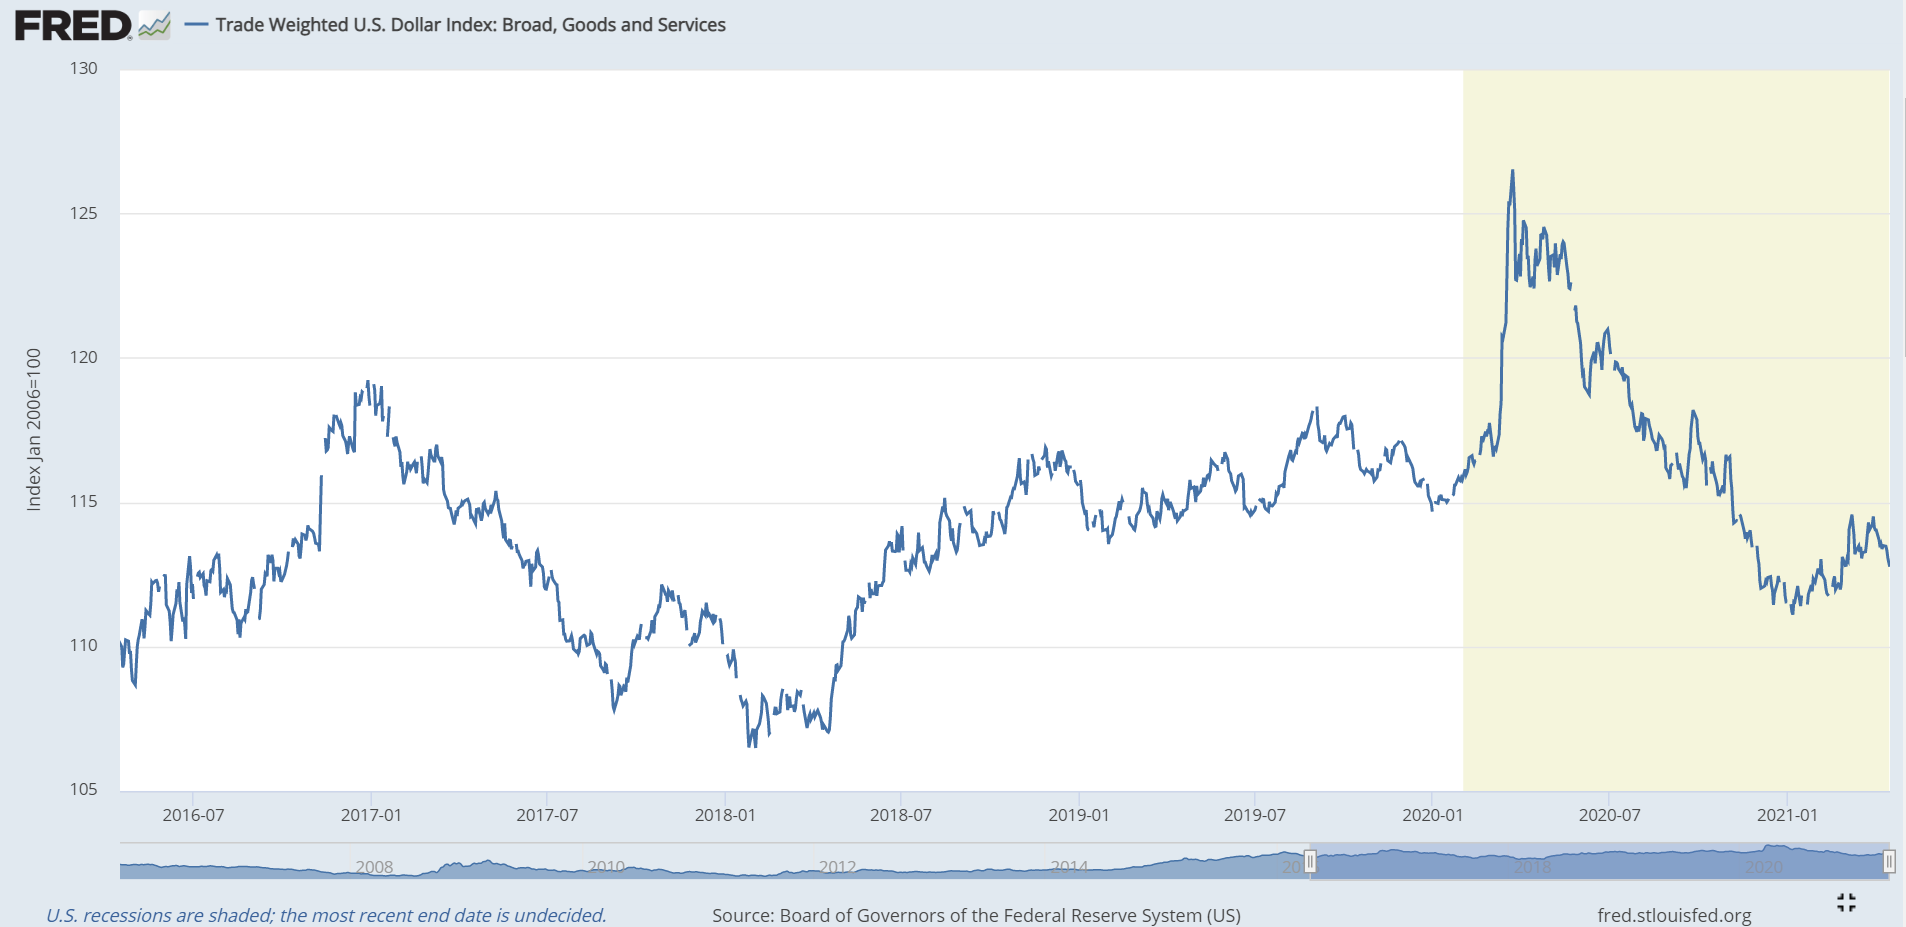
Trade-weighted dollar index
This is the broadest dollar measure we have. It is much more broad than the DXY index. It is delayed by 10 days, but looks very similar to the DXY, other than this cycle's low is quite a bit higher compared to 2018.
Thanks for read. Subscribe and share!
A
Enjoying these posts? Subscribe for more
Subscribe nowAlready have an account? Sign in